Developers
Quickstart
Android
Overview
Step 1. Create an input
Step 2. Verify your input
Step 3. Set up your output
Step 4. Create a connection
Step 5. Verify your connection
Step 6. Track events
Step 7. Track user data
Step 8. Create a data plan
Step 9. Test your local app
iOS Quick Start
Overview
Step 1. Create an input
Step 2. Verify your input
Step 3. Set up your output
Step 4. Create a connection
Step 5. Verify your connection
Step 6. Track events
Step 7. Track user data
Step 8. Create a data plan
Web
Overview
Step 1. Create an input
Step 2. Verify your input
Step 3. Set up your output
Step 4. Create a connection
Step 5. Verify your connection
Step 6. Track events
Step 7. Track user data
Step 8. Create a data plan
Python Quick Start
Step 1. Create an input
Step 2. Create an output
Step 3. Verify output
API References
Data Subject Request API
Data Subject Request API Version 1 and 2
Data Subject Request API Version 3
Warehouse Sync API
Warehouse Sync API Overview
Warehouse Sync API Tutorial
Warehouse Sync API Reference
Data Mapping
Warehouse Sync SQL Reference
Warehouse Sync Troubleshooting Guide
ComposeID
Warehouse Sync API v2 Migration
Platform API
Key Management
Platform API Overview
Accounts
Apps
Audiences
Calculated Attributes
Data Points
Feeds
Field Transformations
Services
Users
Workspaces
Audit Logs API
Calculated Attributes Seeding API
Bulk Profile Deletion API Reference
Custom Access Roles API
Household Reach API Reference
Data Planning API
Pixel Service
Profile API
Events API
mParticle JSON Schema Reference
IDSync
Client SDKs
Android
Initialization
Configuration
Network Security Configuration
Event Tracking
User Attributes
IDSync
Screen Events
Commerce Events
Location Tracking
Media
Kits
Application State and Session Management
Data Privacy Controls
Error Tracking
Opt Out
Push Notifications
WebView Integration
Logger
Preventing Blocked HTTP Traffic with CNAME
Workspace Switching
Linting Data Plans
Troubleshooting the Android SDK
API Reference
Upgrade to Version 5
Upgrade to Version 6
AMP
AMP SDK
Cordova
Cordova Plugin
Identity
Direct Url Routing
Direct URL Routing FAQ
Web
Android
iOS
iOS
Workspace Switching
Initialization
Configuration
Event Tracking
User Attributes
IDSync
Screen Tracking
Commerce Events
Location Tracking
Media
Kits
Application State and Session Management
Data Privacy Controls
Error Tracking
Opt Out
Push Notifications
Webview Integration
Upload Frequency
Preventing Blocked HTTP Traffic with CNAME
Linting Data Plans
Troubleshooting iOS SDK
Social Networks
iOS 14 Guide
iOS 15 FAQ
iOS 16 FAQ
iOS 17 FAQ
iOS 18 FAQ
API Reference
Upgrade to Version 7
Upgrade to Version 9
React Native
Getting Started
Identity
.NET MAUI
Getting Started
Identity
Unity
Upload Frequency
Getting Started
Opt Out
Initialize the SDK
Event Tracking
Commerce Tracking
Error Tracking
Screen Tracking
Identity
Location Tracking
Session Management
Web
Initialization
Configuration
Content Security Policy
Event Tracking
User Attributes
IDSync
Page View Tracking
Commerce Events
Location Tracking
Media
Kits
Application State and Session Management
Data Privacy Controls
Error Tracking
Opt Out
Custom Logger
Persistence
Native Web Views
Self-Hosting
Multiple Instances
Web SDK via Google Tag Manager
Preventing Blocked HTTP Traffic with CNAME
Facebook Instant Articles
Troubleshooting the Web SDK
Browser Compatibility
Linting Data Plans
API Reference
Upgrade to Version 3 of the SDK
Alexa
Server SDKs
Node SDK
Go SDK
Python SDK
Ruby SDK
Java SDK
Guides
Partners
Introduction
Outbound Integrations
Outbound Integrations
Firehose Java SDK
Inbound Integrations
Compose ID
Data Hosting Locations
Migrate from Segment to mParticle
Migrate from Segment to mParticle
Migrate from Segment to Client-side mParticle
Migrate from Segment to Server-side mParticle
Segment-to-mParticle Migration Reference
Glossary
Rules Developer Guide
API Credential Management
The Developer's Guided Journey to mParticle
Guides
Composable Audiences
Composable Audiences Overview
User Guide
User Guide Overview
Warehouse Setup
Warehouse Setup Overview
Audience Setup
Frequently Asked Questions
Customer 360
Overview
User Profiles
Overview
User Profiles
Household Reach
Calculated Attributes
Calculated Attributes Overview
Using Calculated Attributes
Create with AI Assistance
Calculated Attributes Reference
Predictions
Predictions Overview
What's Changed in the New Predictions UI
View and Manage Predictions
Predict Future Behavior
Future Behavior Predictions Overview
Create Future Behavior Prediction
Manage Future Behavior Predictions
Create an Audience with Future Behavior Predictions
Identity
Identity Dashboard
Identity Logs
Getting Started
Create an Input
Start capturing data
Connect an Event Output
Create an Audience
Connect an Audience Output
Transform and Enhance Your Data
Platform Guide
Billing
Usage and Billing Report
Observability
Observability Overview
Observability User Guide
Observability Troubleshooting Examples
Observability Span Glossary
The New mParticle Experience
The new mParticle Experience
The Overview Map
Platform Settings
Audit Logs
Key Management
Platform Configuration
Event Forwarding
Event Match Quality Dashboard
Notifications
System Alerts
Trends
Introduction
Data Retention
Data Catalog
Connections
Activity
Data Plans
Live Stream
Filters
Consent Filters
Rules
Blocked Data Backfill Guide
Tiered Events
mParticle Users and Roles
Analytics Free Trial
Troubleshooting mParticle
Usage metering for value-based pricing (VBP)
IDSync
IDSync Overview
Use Cases for IDSync
Components of IDSync
Store and Organize User Data
Identify Users
Default IDSync Configuration
Profile Conversion Strategy
Profile Link Strategy
Profile Isolation Strategy
Best Match Strategy
Aliasing
Segmentation
Audiences
Audiences Overview
Create an Audience
Connect an Audience
Manage Audiences
Audience Insights
Audience Sharing
Match Boost
Inclusive & Exclusive Audiences (Early Access)
Inclusive & Exclusive Audiences Overview
Using Logic Blocks in Audiences
Combining Inclusive and Exclusive Audiences
Inclusive & Exclusive Audiences FAQ
Audience Expansion
Predictive Audiences
Predictive Audiences Overview
Using Predictive Audiences
mParticle Agent
Overview
Explore Your Data
Build Audiences
Create Predictions
Data and Privacy
mParticle Agent FAQ
Analytics
Introduction
Core Analytics (Beta)
Setup
Sync and Activate Analytics User Segments in mParticle
User Segment Activation
Welcome Page Announcements
Settings
Project Settings
Roles and Teammates
Organization Settings
Global Project Filters
Portfolio Analytics
Analytics Data Manager
Analytics Data Manager Overview
Events
Event Properties
User Properties
Revenue Mapping
Export Data
UTM Guide
Analyses
Analyses Introduction
Segmentation: Basics
Getting Started
Visualization Options
For Clauses
Date Range and Time Settings
Calculator
Numerical Settings
Segmentation: Advanced
Assisted Analysis
Properties Explorer
Frequency in Segmentation
Trends in Segmentation
Did [not] Perform Clauses
Cumulative vs. Non-Cumulative Analysis in Segmentation
Total Count of vs. Users Who Performed
Save Your Segmentation Analysis
Export Results in Segmentation
Explore Users from Segmentation
Funnels: Basics
Getting Started with Funnels
Group By Settings
Conversion Window
Tracking Properties
Date Range and Time Settings
Visualization Options
Interpreting a Funnel Analysis
Funnels: Advanced
Group By
Filters
Conversion over Time
Conversion Order
Trends
Funnel Direction
Multi-path Funnels
Analyze as Cohort from Funnel
Save a Funnel Analysis
Explore Users from a Funnel
Export Results from a Funnel
Saved Analyses
Manage Analyses in Dashboards
Query Builder
Data Dictionary
Query Builder Overview
Modify Filters With And/Or Clauses
Query-time Sampling
Query Notes
Filter Where Clauses
Event vs. User Properties
Group By Clauses
Annotations
Cross-tool Compatibility
Apply All for Filter Where Clauses
Date Range and Time Settings Overview
User Attributes at Event Time
Understanding the Screen View Event
User Aliasing
Dashboards
Dashboards––Getting Started
Manage Dashboards
Dashboard Filters
Organize Dashboards
Scheduled Reports
Favorites
Time and Interval Settings in Dashboards
Query Notes in Dashboards
Analytics Resources
The Demo Environment
Keyboard Shortcuts
User Segments
Data Privacy Controls
Data Subject Requests
Default Service Limits
Feeds
Import Data with CSV Files
Import Data with CSV Files
CSV File Reference
SFTP Credentials
Glossary
Video Index
Analytics (Deprecated)
Identity Providers
Single Sign-On (SSO)
Setup Examples
Introduction
Developer Docs
Introduction
Integrations
Introduction
Rudderstack
Google Tag Manager
Segment
Data Warehouses and Data Lakes
Advanced Data Warehouse Settings
AWS Kinesis (Snowplow)
AWS Redshift (Define Your Own Schema)
AWS S3 Integration (Define Your Own Schema)
AWS S3 (Snowplow Schema)
BigQuery (Snowplow Schema)
BigQuery Firebase Schema
BigQuery (Define Your Own Schema)
GCP BigQuery Export
Snowflake (Snowplow Schema)
Snowplow Schema Overview
Snowflake (Define Your Own Schema)
Developer Basics
Aliasing
Integrations
24i
Event
Aarki
Audience
Actable
Feed
ABTasty
Audience
Adobe Marketing Cloud
Cookie Sync
Platform SDK Events
Server-to-Server Events
AdMedia
Audience
AdChemix
Event
Adobe Audience Manager
Audience
Adobe Campaign Manager
Audience
Adobe Experience Platform
Event
Adobe Target
Audience
AdPredictive
Feed
AgilOne
Event
Algolia
Event
Amazon Kinesis
Event
Amazon Redshift
Data Warehouse
Amazon SNS
Event
Amazon SQS
Event
Amobee
Audience
Antavo
Feed
Anodot
Event
Apptentive
Event
Apptimize
Event
Apteligent
Event
Microsoft Azure Blob Storage
Event
Bing Ads
Event
Bidease
Audience
Bluecore
Event
Bluedot
Feed
Branch S2S Event
Event
Bugsnag
Event
Cadent
Audience
Census
Feed
comScore
Event
Conversant
Event
Crossing Minds
Event
Custom Feed
Custom Feed
Datadog
Event
Databricks
Data Warehouse
Didomi
Event
Eagle Eye
Audience
Edge226
Audience
Emarsys
Audience
Everflow
Audience
Epsilon
Event
Facebook Offline Conversions
Event
Google Analytics for Firebase
Event
Flybits
Event
Flurry
Event
ForeSee
Event
Friendbuy
Event
FreeWheel Data Suite
Audience
Google Ad Manager
Audience
Google Analytics
Event
Google Analytics 4
Event
Google BigQuery
Data Warehouse
Audience
Google Enhanced Conversions
Event
Google Marketing Platform Offline Conversions
Event
Google Marketing Platform
Audience
Cookie Sync
Event
Google Pub/Sub
Event
Google Tag Manager
Event
Heap
Event
Hightouch
Feed
Herow
Feed
Hyperlocology
Event
Ibotta
Event
ID5
Kit
Impact
Event
InMarket
Audience
Inspectlet
Event
Intercom
Event
ironSource
Audience
Kafka
Event
Kissmetrics
Event
LaunchDarkly
Feed
Kubit
Event
LifeStreet
Audience
LiveLike
Event
Liveramp
Audience
Localytics
Event
mAdme Technologies
Event
MadHive
Audience
Marigold
Audience
MediaMath
Audience
Microsoft Ads
Microsoft Ads Audience Integration
Mediasmart
Audience
Microsoft Azure Event Hubs
Event
Mintegral
Audience
Monetate
Event
Movable Ink
Event
Movable Ink - V2
Event
Multiplied
Event
Nami ML
Feed
Nanigans
Event
NCR Aloha
Event
Neura
Event
OneTrust
Event
Oracle BlueKai
Event
Paytronix
Feed
Persona.ly
Audience
Personify XP
Event
Plarin
Event
Primer
Event
Quantcast
Event
Qualtrics
Event
Rakuten
Event
Awin
Event
Regal
Event
Reveal Mobile
Event
RevenueCat
Feed
Salesforce Mobile Push
Event
Scalarr
Event
SFTP
Audience
Shopify
Custom Pixel
Feed
SimpleReach
Event
Skyhook
Event
Singular-DEPRECATED
Event
Smadex
Audience
Slack
Event
SmarterHQ
Event
Snapchat Conversions
Event
Snowflake
Audience
Data Warehouse
Snowplow
Event
Splunk MINT
Event
StartApp
Audience
Spotify
Event
Tapad
Audience
Talon.One
Event
Audience
Feed
Loyalty Feed
Taplytics
Event
Tapjoy
Audience
Taptica
Audience
Teak
Audience
Ticketure
Feed
The Trade Desk
Audience
Cookie Sync
Event
TUNE
Event
Triton Digital
Audience
Valid
Event
Vkontakte
Audience
Vibe
Audience
Webhook
Event
Vungle
Audience
Webtrends
Event
White Label Loyalty
Event
Wootric
Event
Yahoo (formerly Verizon Media)
Audience
Cookie Sync
Xandr
Audience
Cookie Sync
Yotpo
Feed
YouAppi
Audience
Create an Audience
Creating an audience begins with defining your use case, segmentation approach, and engagement strategy. To do this, consider the following questions:
- What is the business goal you are trying to accomplish?
- Which customer segments are important to achieving this business goal?
- Once you identify the relevant users, what is your strategy for engaging them?
Example Use Cases
Increase User Retention for a Mobile App
Retaining users is crucial for the sustained success of a mobile application. By identifying and re-engaging inactive users, you can boost overall engagement and reduce user drop-off.
Goal: Improve user retention by targeting users who have not opened the app in the last 7 days.
Segmentation Strategy: Identify users who have been inactive for a week but used the app actively within the previous month.
Engagement Strategy: Send personalized push notifications offering a discount or exclusive content to re-engage users.
Predictive Audience for Likely Purchasers
Leveraging predictive analytics allows businesses to anticipate user behavior and proactively engage those most likely to convert, thereby optimizing marketing efforts.
Goal: Increase conversion rates by targeting users predicted to make a purchase in the next 7 days.
Segmentation Strategy: Utilize Predictive Audiences to identify users with a high likelihood of purchasing based on machine learning models analyzing past behaviors and interactions.
Engagement Strategy: Deliver personalized email campaigns featuring product recommendations or special offers to these high-likelihood purchasers.
Optimize Engagement in a Subscription Service
Identifying subscribers at risk of cancelling enables proactive engagement strategies to maintain a stable subscriber base.
Goal: Reduce cancellations by identifying at-risk subscribers.
Segmentation Strategy: Identify users whose subscription renewal is within the next 30 days and who have decreased engagement (e.g., fewer logins or interactions).
Engagement Strategy: Offer these users tailored incentives such as a loyalty bonus or a discounted renewal rate to encourage continued subscription.
Create a New Audience
Once you have clearly defined your use case, it’s time to begin building your audience.
Navigate to the Audience Creation Page
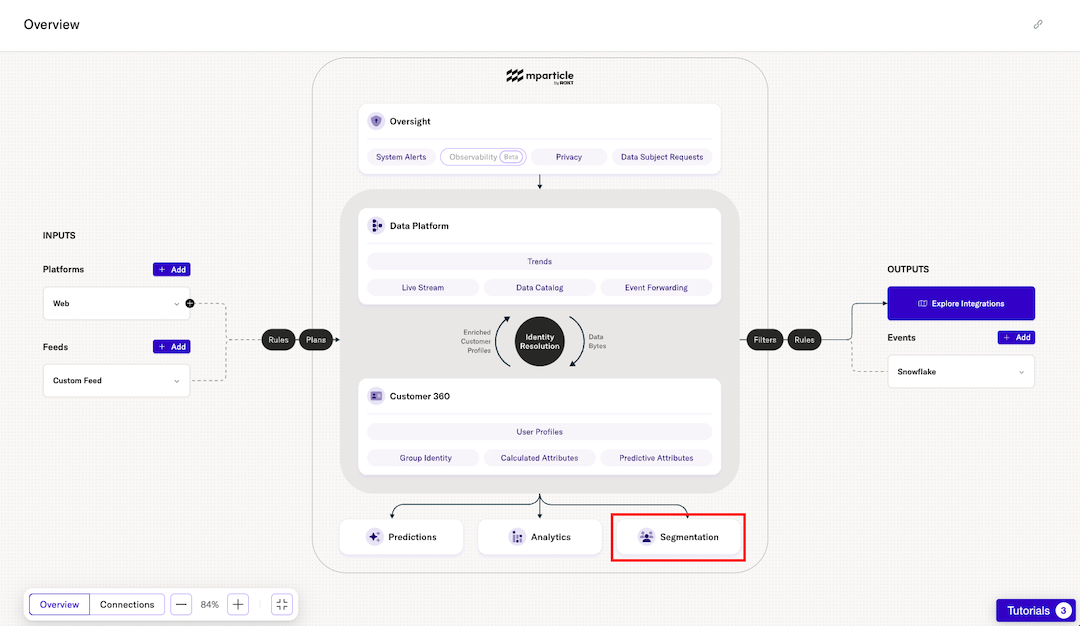
- From the mParticle Overview Map, select Segmentation.
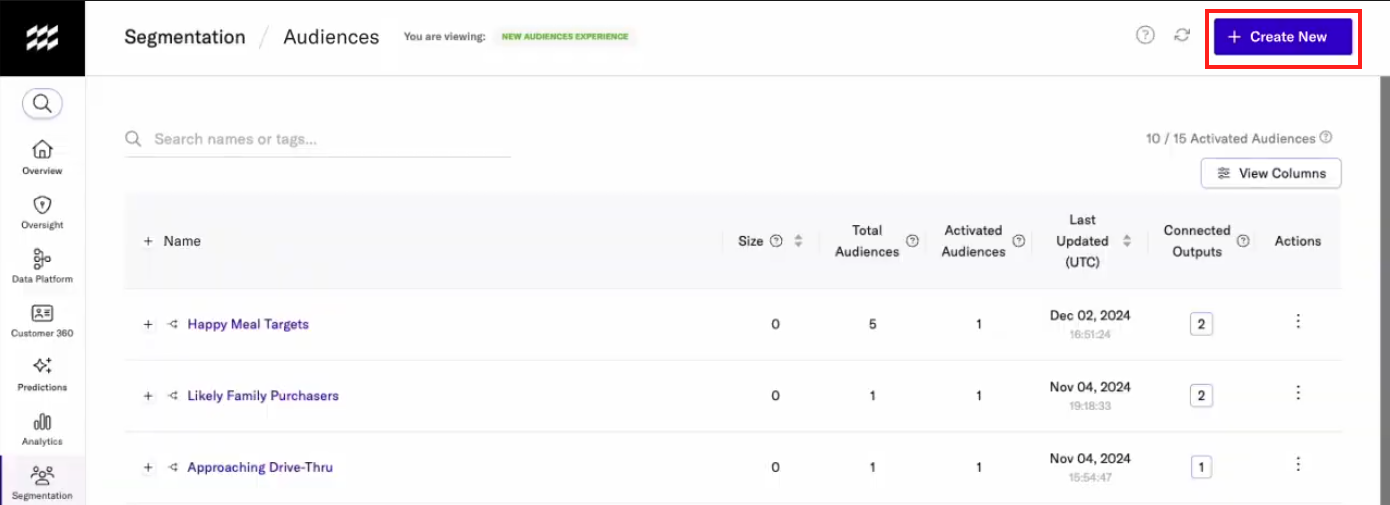
- On the Audiences landing page, click Create New.
Configure your audience group
Individual audiences are contained within folders called audience groups. The first step in creating a new audience is to configure this folder:
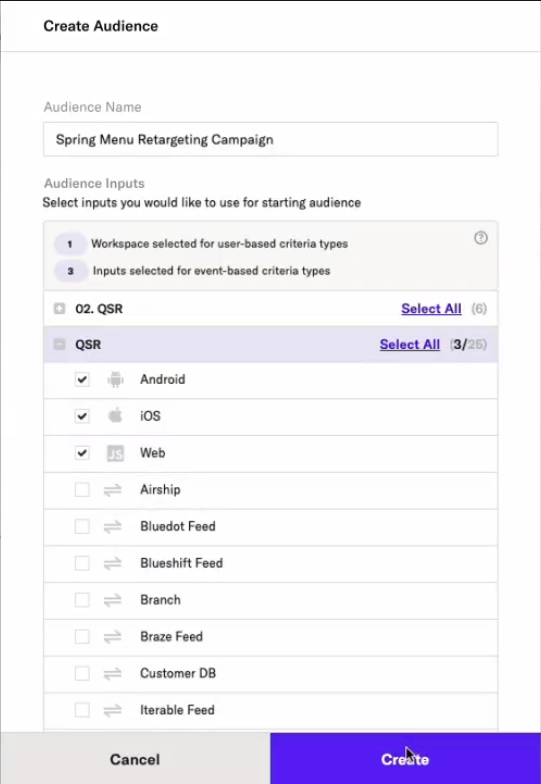
- Enter a name for your folder.
- Select your Inputs (the platforms and feeds that will supply data to define the audiences within your folder).
- Click Create.
Define Your Audience
After saving your audience group, you’ll enter the Editor. Here is where you can add, view, edit, and connect audiences.
Follow the steps below to create your first audience within this folder:
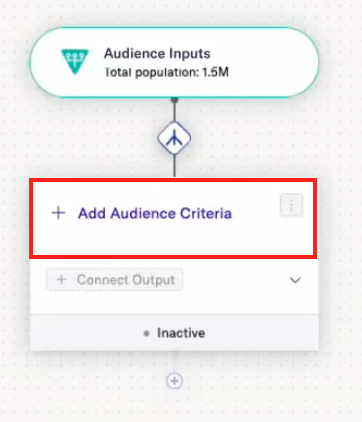
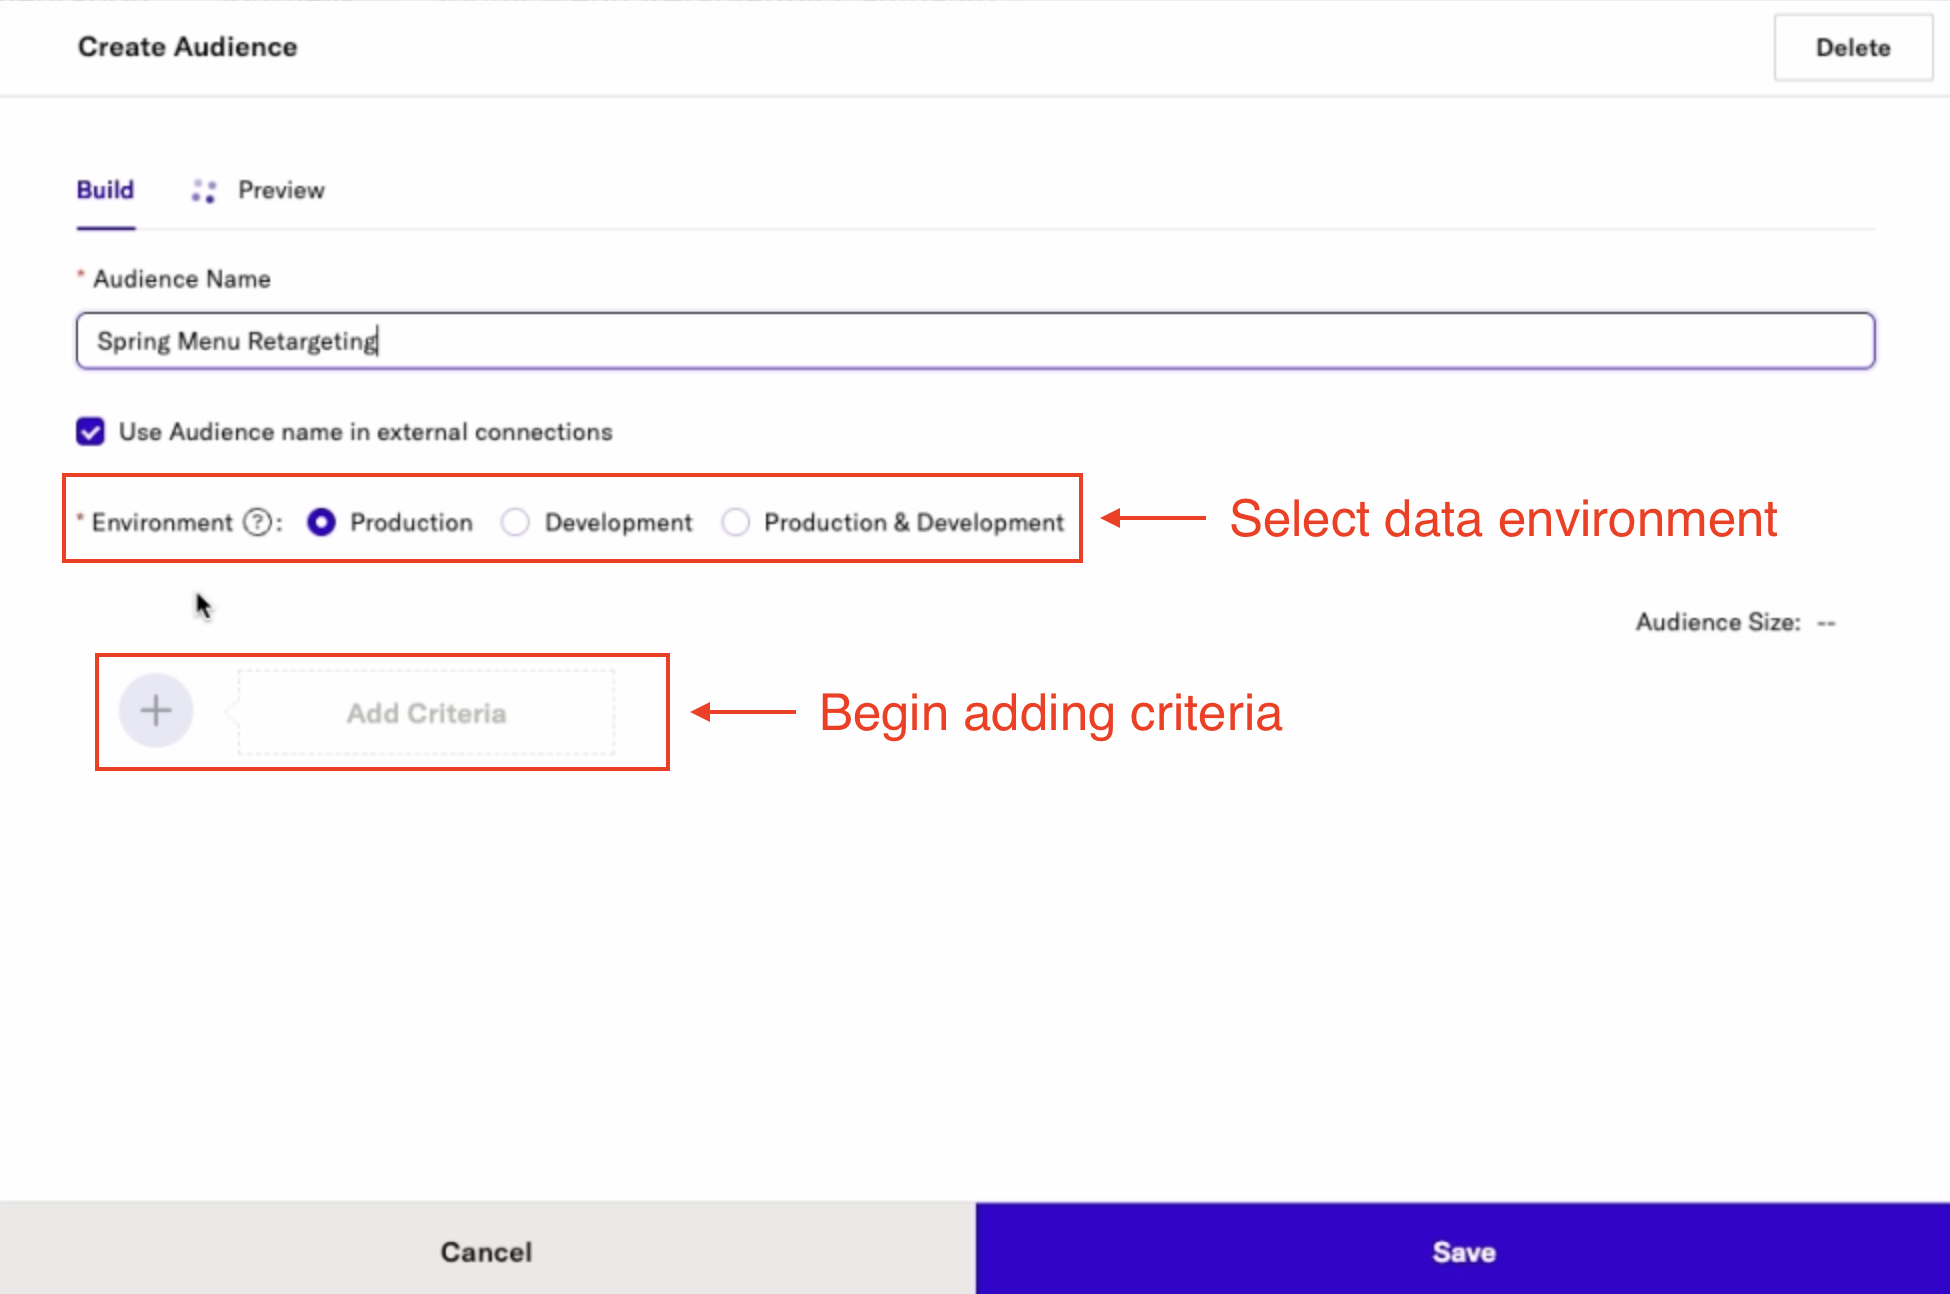
- Click the Add criteria box to open the Audience Builder Modal.
- In the audience builder modal, choose the environment (Production, Development, or both) from which the audience will receive data. (Note the audience environment considerations below.)
- Click Add Criteria to begin adding criteria for your audience.
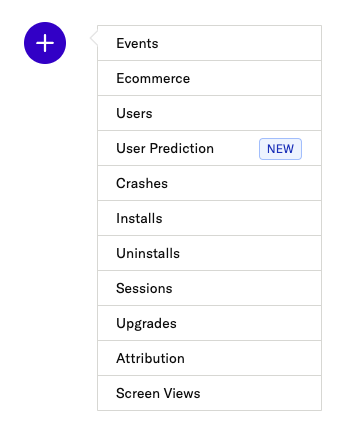
- Select the type of data you would like to use for your first criteria (more on criteria types below).
- Referring to the data types and matching rules below, use the criteria editor to further target the users who fit your use case.
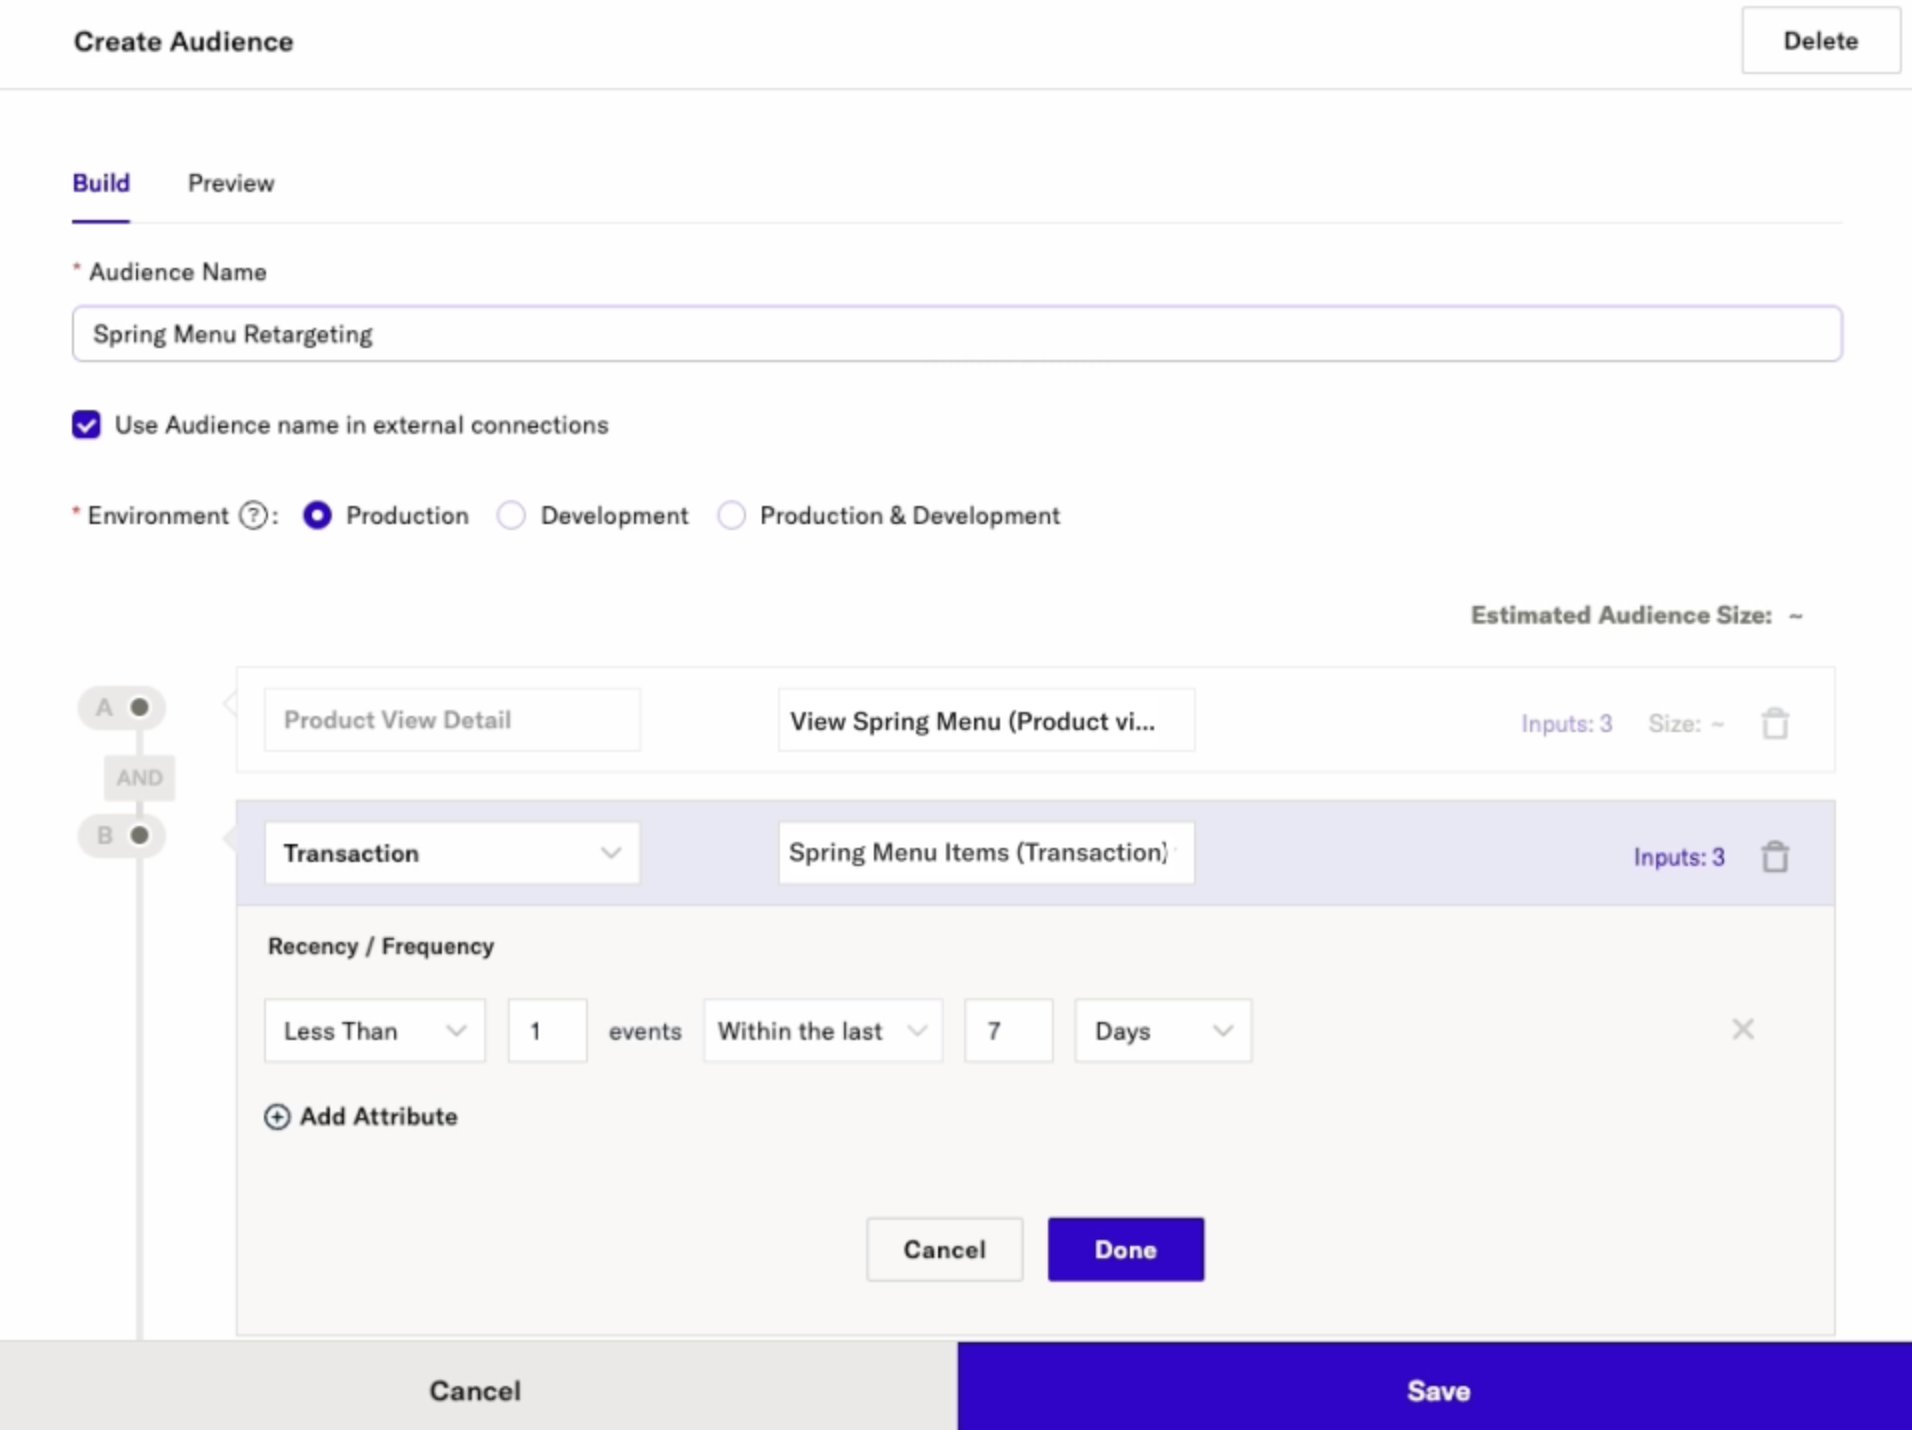 .
. - Once you have added your first criteria, click Done.
After you have added your first criteria, a number displays that represents the estimated audience size:
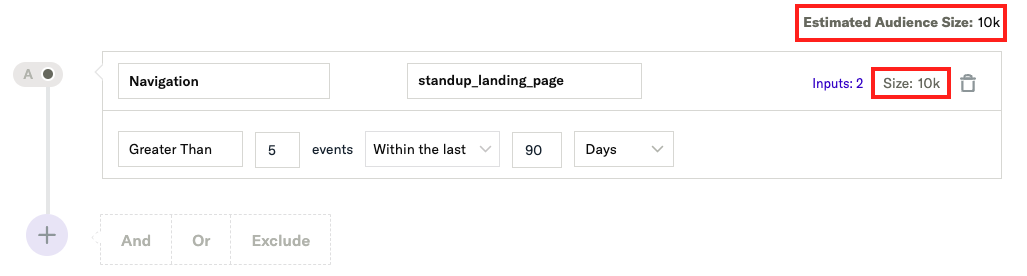 .
This estimate is based on a sample of data. As you continue to add criteria, you will see an estimated size for both individual criteria as well as for the whole audience.
.
This estimate is based on a sample of data. As you continue to add criteria, you will see an estimated size for both individual criteria as well as for the whole audience.
- Continue adding more criteria using And, Or, or Exclude logic to further refine your audience.
Time delays
Time delays are configurable waiting periods between parent and child audiences. When a user qualifies for and is added to a parent audience, the delay postpones their evaluation for membership in the child audience until the configured duration has elapsed.
Use time delays for customer lifecycle sequences that depend on timing as well as eligibility, including nurture cadences, retargeting cooldowns, delayed re-engagement, or any part of the customer journey where engaging with the customer immediately would be premature or create a poor experience.
How time delays work
A time delay governs when mParticle evaluates members of a parent audience for membership in a child audience.
- When a user qualifies for and is added to the parent audience, their countdown for the delayed child audience begins.
- While waiting, the user isn’t a member of the child audience and isn’t forwarded to outputs connected to the child audience.
- When the time delay completes, mParticle evaluates the user against the child audience’s criteria.
- If the user qualifies, mParticle adds them to the child audience and forwards their membership to its connected outputs. If the user doesn’t qualify, they leave the waiting period without being added to the child audience.
Example: Post-purchase follow-up
Imagine you are a retailer and you want to contact customers 3 days after a purchase, but only if they haven’t made an additional purchase. You would create a Recent Purchasers parent audience for users with a purchase in the last 7 days and a Day 3 Follow-Up child audience for users with exactly one purchase during that period. Then, you would add a 3-day time delay for the child audience.
A customer who makes a purchase on Monday is added to Recent Purchasers, which starts their 3-day countdown for Day 3 Follow-Up. When the delay completes on Thursday, mParticle evaluates the customer against the Day 3 Follow-Up criteria. If they made an additional purchase, they don’t qualify and aren’t added to the child audience. Otherwise, mParticle adds them to Day 3 Follow-Up and forwards their membership to its connected outputs.
Add a time delay to an audience
To add a time delay to an audience:
- In the Audience Group Editor, select the + icon between a parent audience and the child audience you want to add a time delay to.
- Click Add Time Delay.
- Enter the delay duration and select Hours, Days, or Weeks. There is no maximum duration for a time delay.
- Click Add delay.
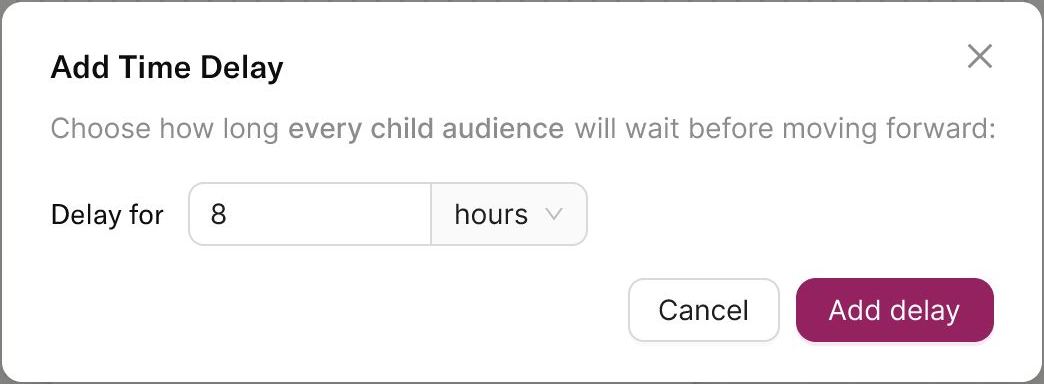
When you add a delay below a parent audience, mParticle applies it to each of that parent’s direct child audiences. The delay doesn’t propagate to deeper descendants.
Time delay precision
Configured time delays represent the minimum duration before mParticle evaluates a parent audience member for membership in a child audience. After the waiting period ends, this evaluation can add a short delay before a qualifying user is added to the child audience. This added latency varies with audience size.
Modifying a time delay
You can edit an individual child audience’s delay independently of its siblings. After you customize any child audience’s delay, the group-level edit control is locked, and you must manage each child audience’s delay individually.
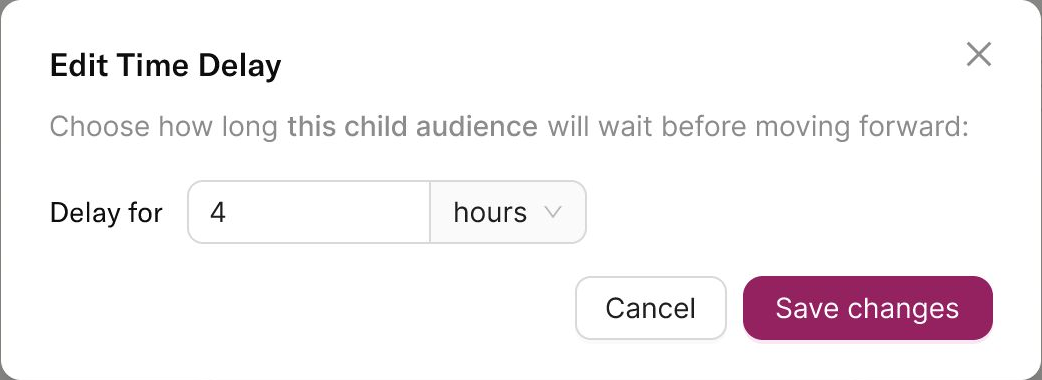
If sibling audiences have different delays, and you add another child node, the new node receives the delay configured on the earliest-created sibling. Review the new node’s delay and adjust it if necessary.
Edit or delete a time delay
When you edit a delay, mParticle recalculates each user’s remaining waiting period from the time they originally entered the child audience’s waiting room. If the revised time delay is shorter than the time a user has already waited, mParticle immediately evaluates the user against the child audience’s criteria.
When you delete a delay, mParticle immediately evaluates every user in the child audience’s waiting room. Users who meet the child audience’s criteria are added to that audience.
Frequently asked questions
Does a time delay reset if a user drops out of the parent audience and later re-qualifies?
Yes. If the user later re-qualifies for and is added to the parent audience, a new countdown begins for the child audience. Previously elapsed waiting time isn’t preserved.
Can different audiences in an audience group have different delays?
Yes. Set the delay for the parent’s direct child audiences first, then edit individual child audiences. Customizing any individual child audience’s time delay locks the group-level edit control.
What happens if I change the delay duration while users are waiting?
The updated duration applies to users who are already waiting for the child audience. When the updated delay completes, mParticle evaluates each user against the child audience’s criteria. If a user has already waited longer than the updated duration, mParticle evaluates them immediately.
Can I stack delays across multiple audiences?
Yes. Each time a user is added to a parent audience along the path, the countdown begins for the next delayed child audience. The total time required to reach the final audience is the sum of the delays along the path, plus any processing time incurred at each step.
Do waiting users appear in audience exports or downstream syncs?
No. While users are waiting for a child audience, they aren’t members of that audience and aren’t forwarded to its connected outputs.
Why can’t I add a delay to an audience?
The three most common reasons an audience won’t allow you to add a time delay are:
- The audience is the last one in the path and has no child audience below it.
- The path contains an A/B test.
- One of the audiences in the path is not a real-time audience.
Create an A/B Test
Audience A/B testing randomly divides an audience into mutually exclusive variations so you can compare different targeting approaches. Each variation is represented as an individual audience and can be connected to outputs independently.
For example, if you want to reengage an audience of users with low engagement, you could create this test:
- Send 40% of the audience to Messaging Platform A.
- Send 40% of the audience to Messaging Platform B.
- Keep the remaining 20% as an unmessaged control group.
You can then compare engagement across the variations and use the most successful strategy for the full audience.
Add Test Variations
- In the Audience Group Editor, select the option to add a path beneath the audience you want to test, then select A/B Test.
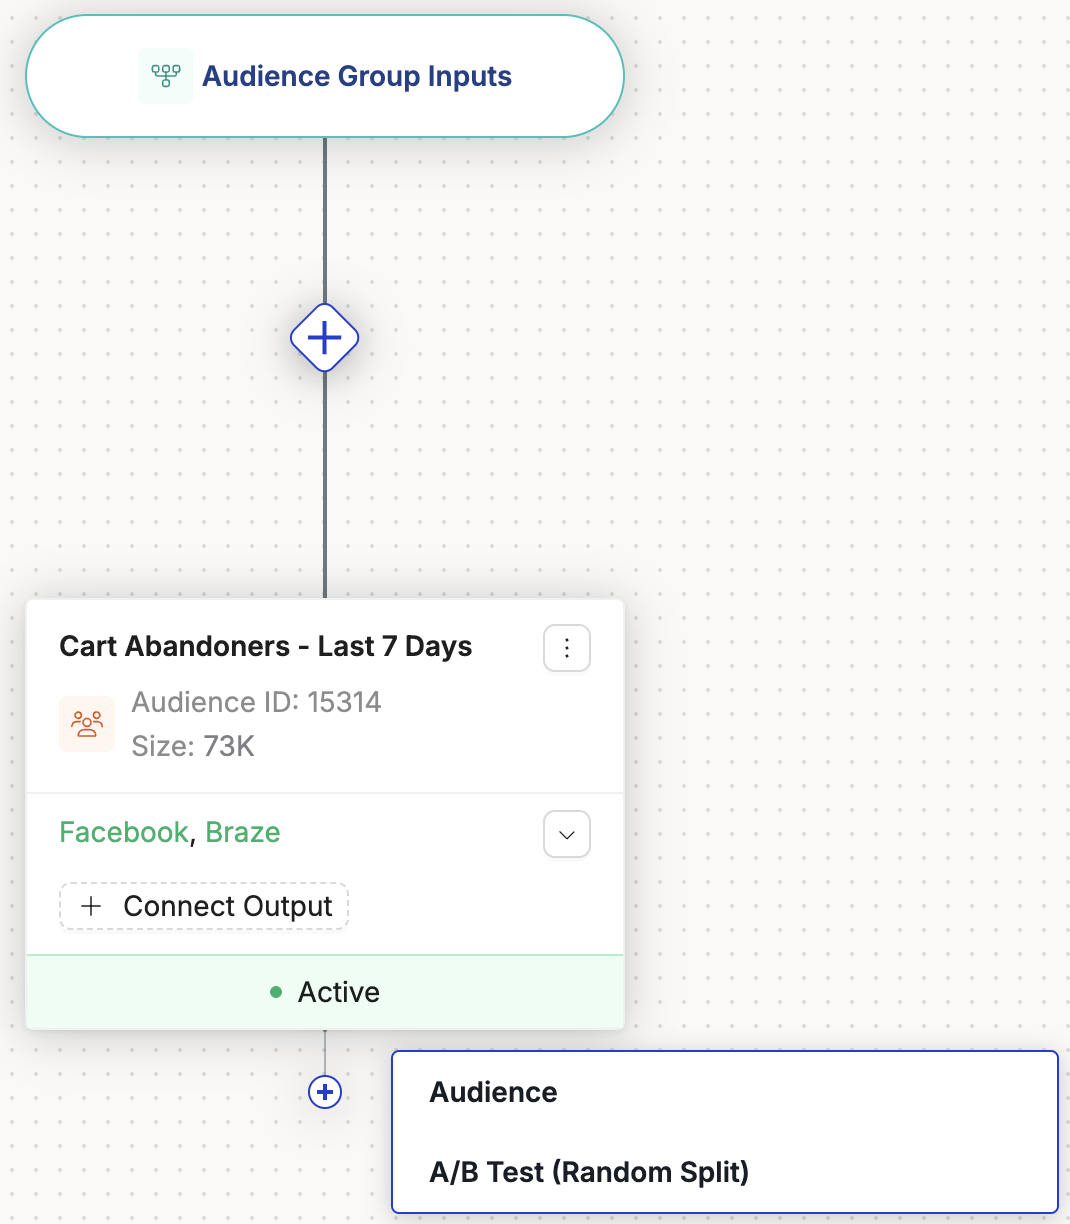
- Add and name up to five test variations, then assign the whole-number percentage of audience members that each variation should receive. Any percentage not assigned to a test variation is assigned to the control group.
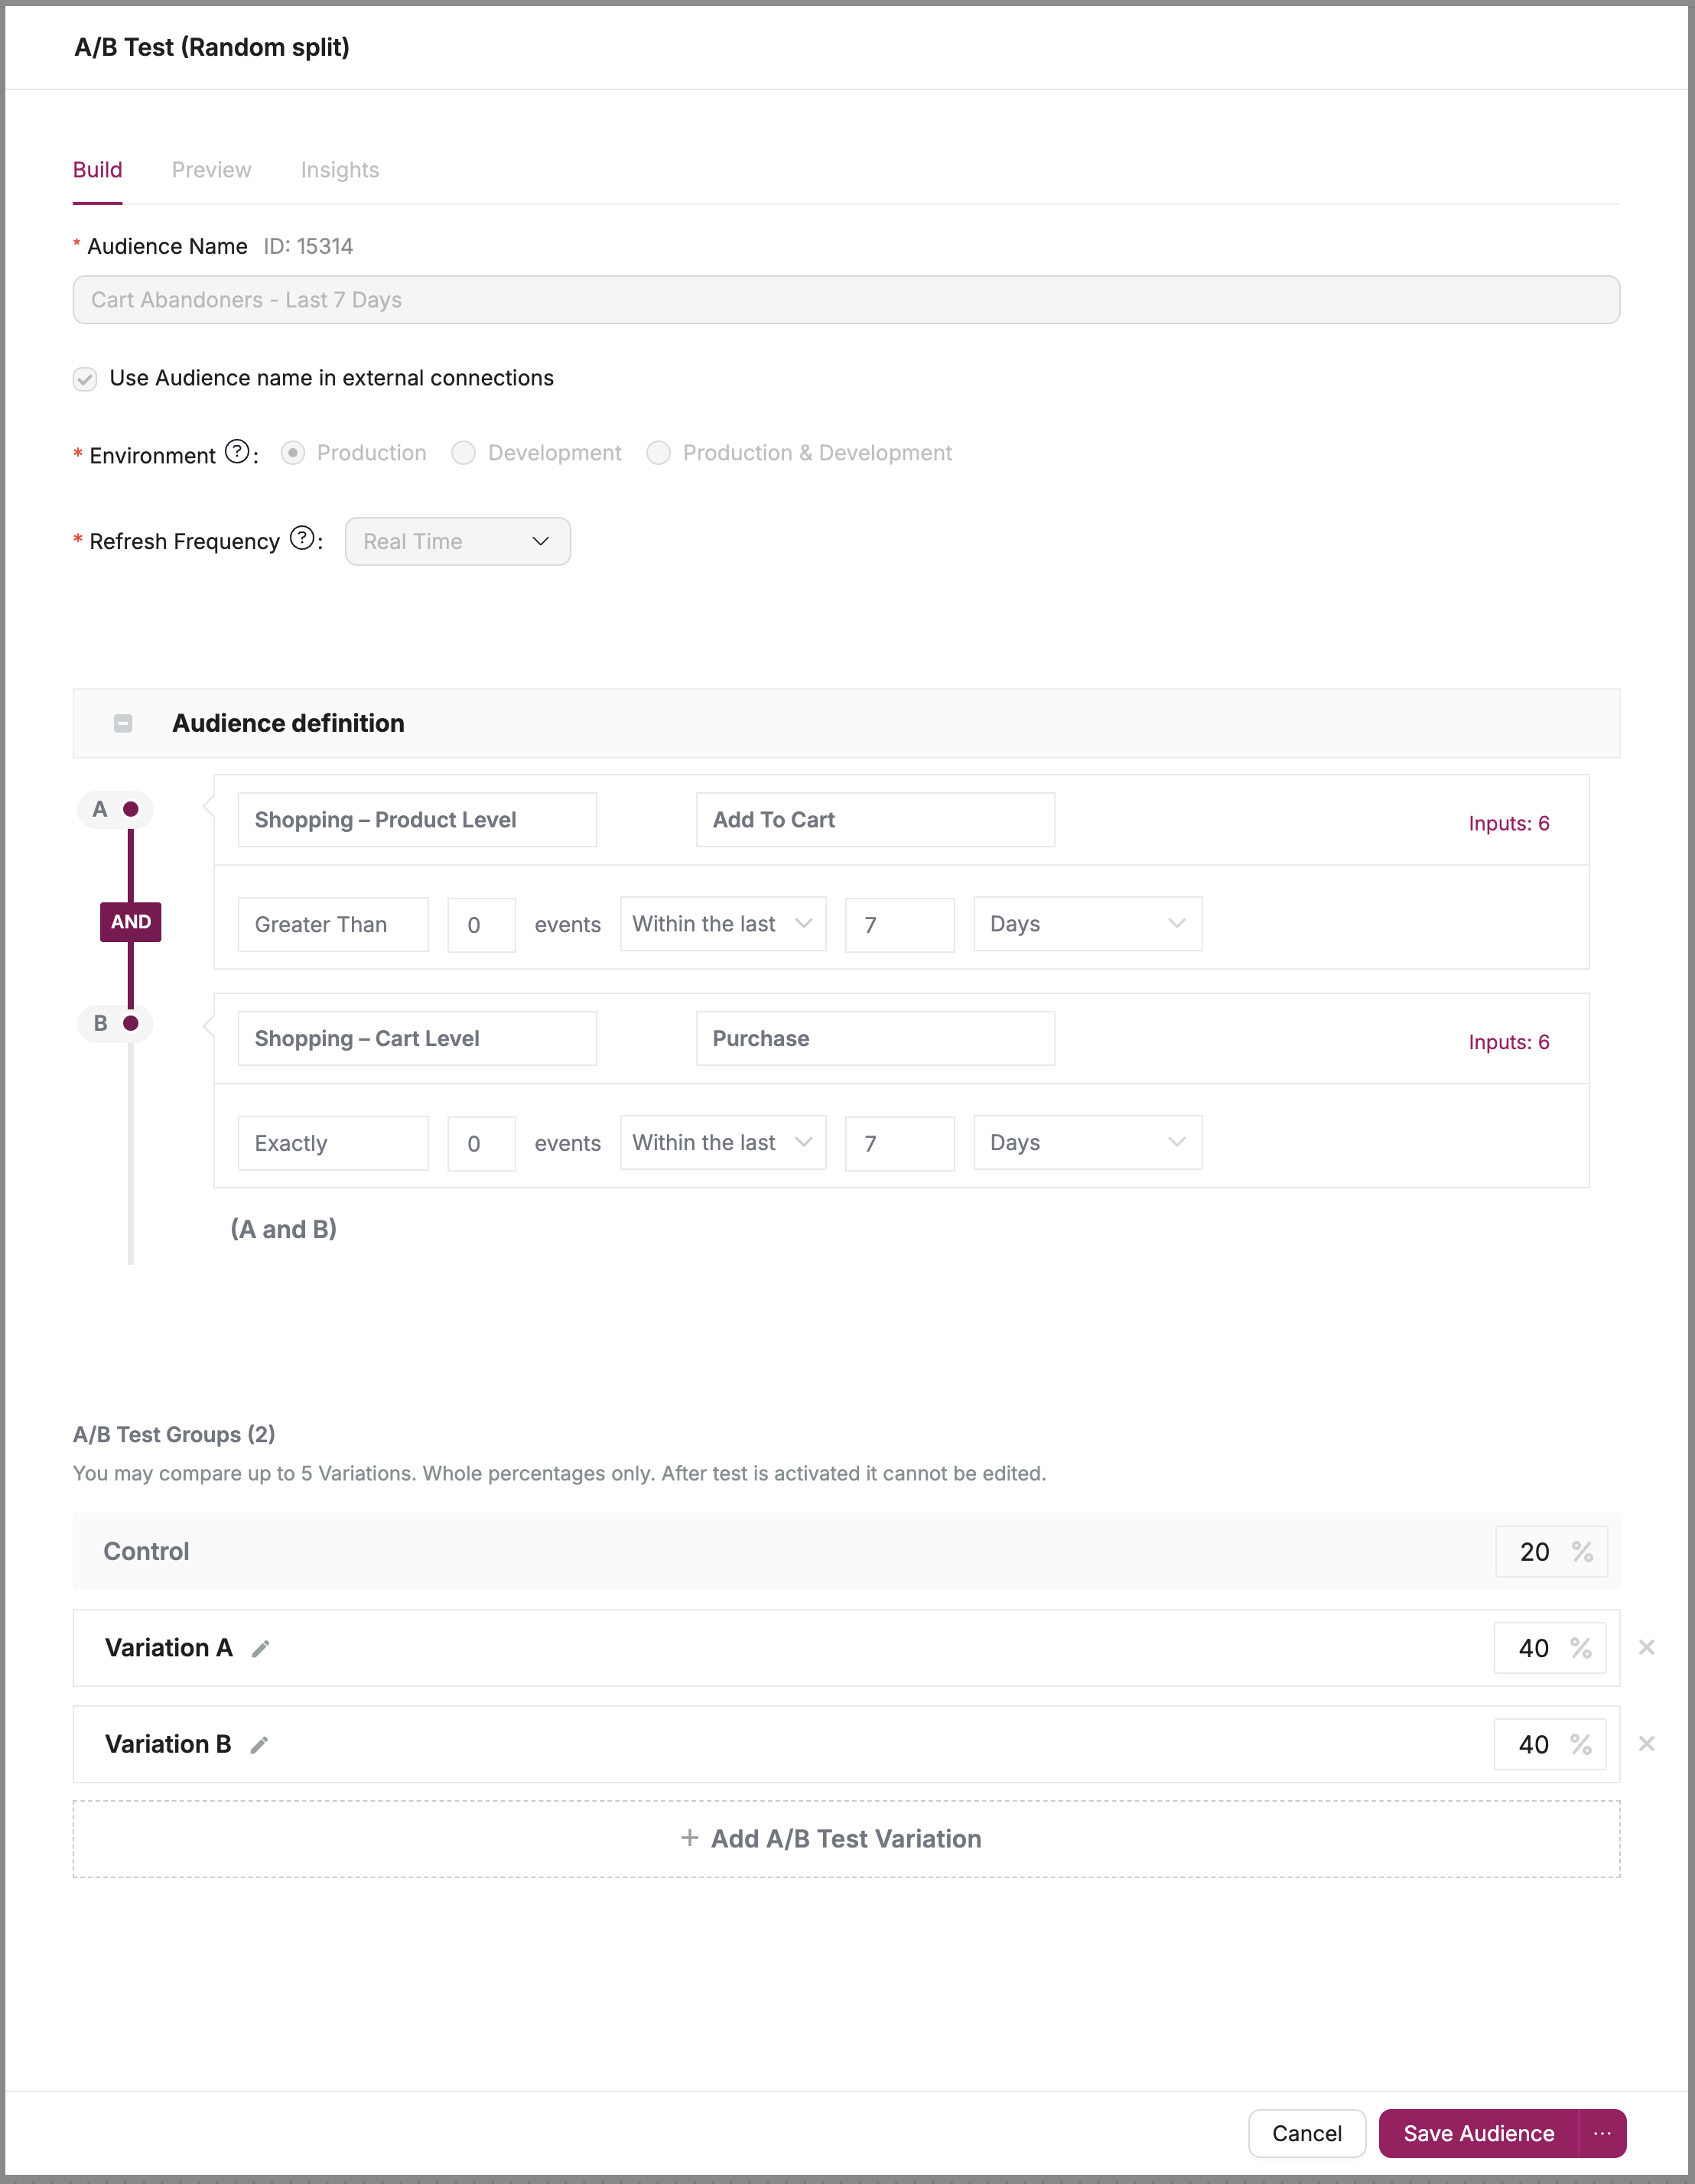
- Review the variation names and allocations, then save the test.
After you save the test, each variation appears as a separate branch in the Audience Group Editor. Audience members are assigned to one variation, including the control group, according to the percentages you configured.
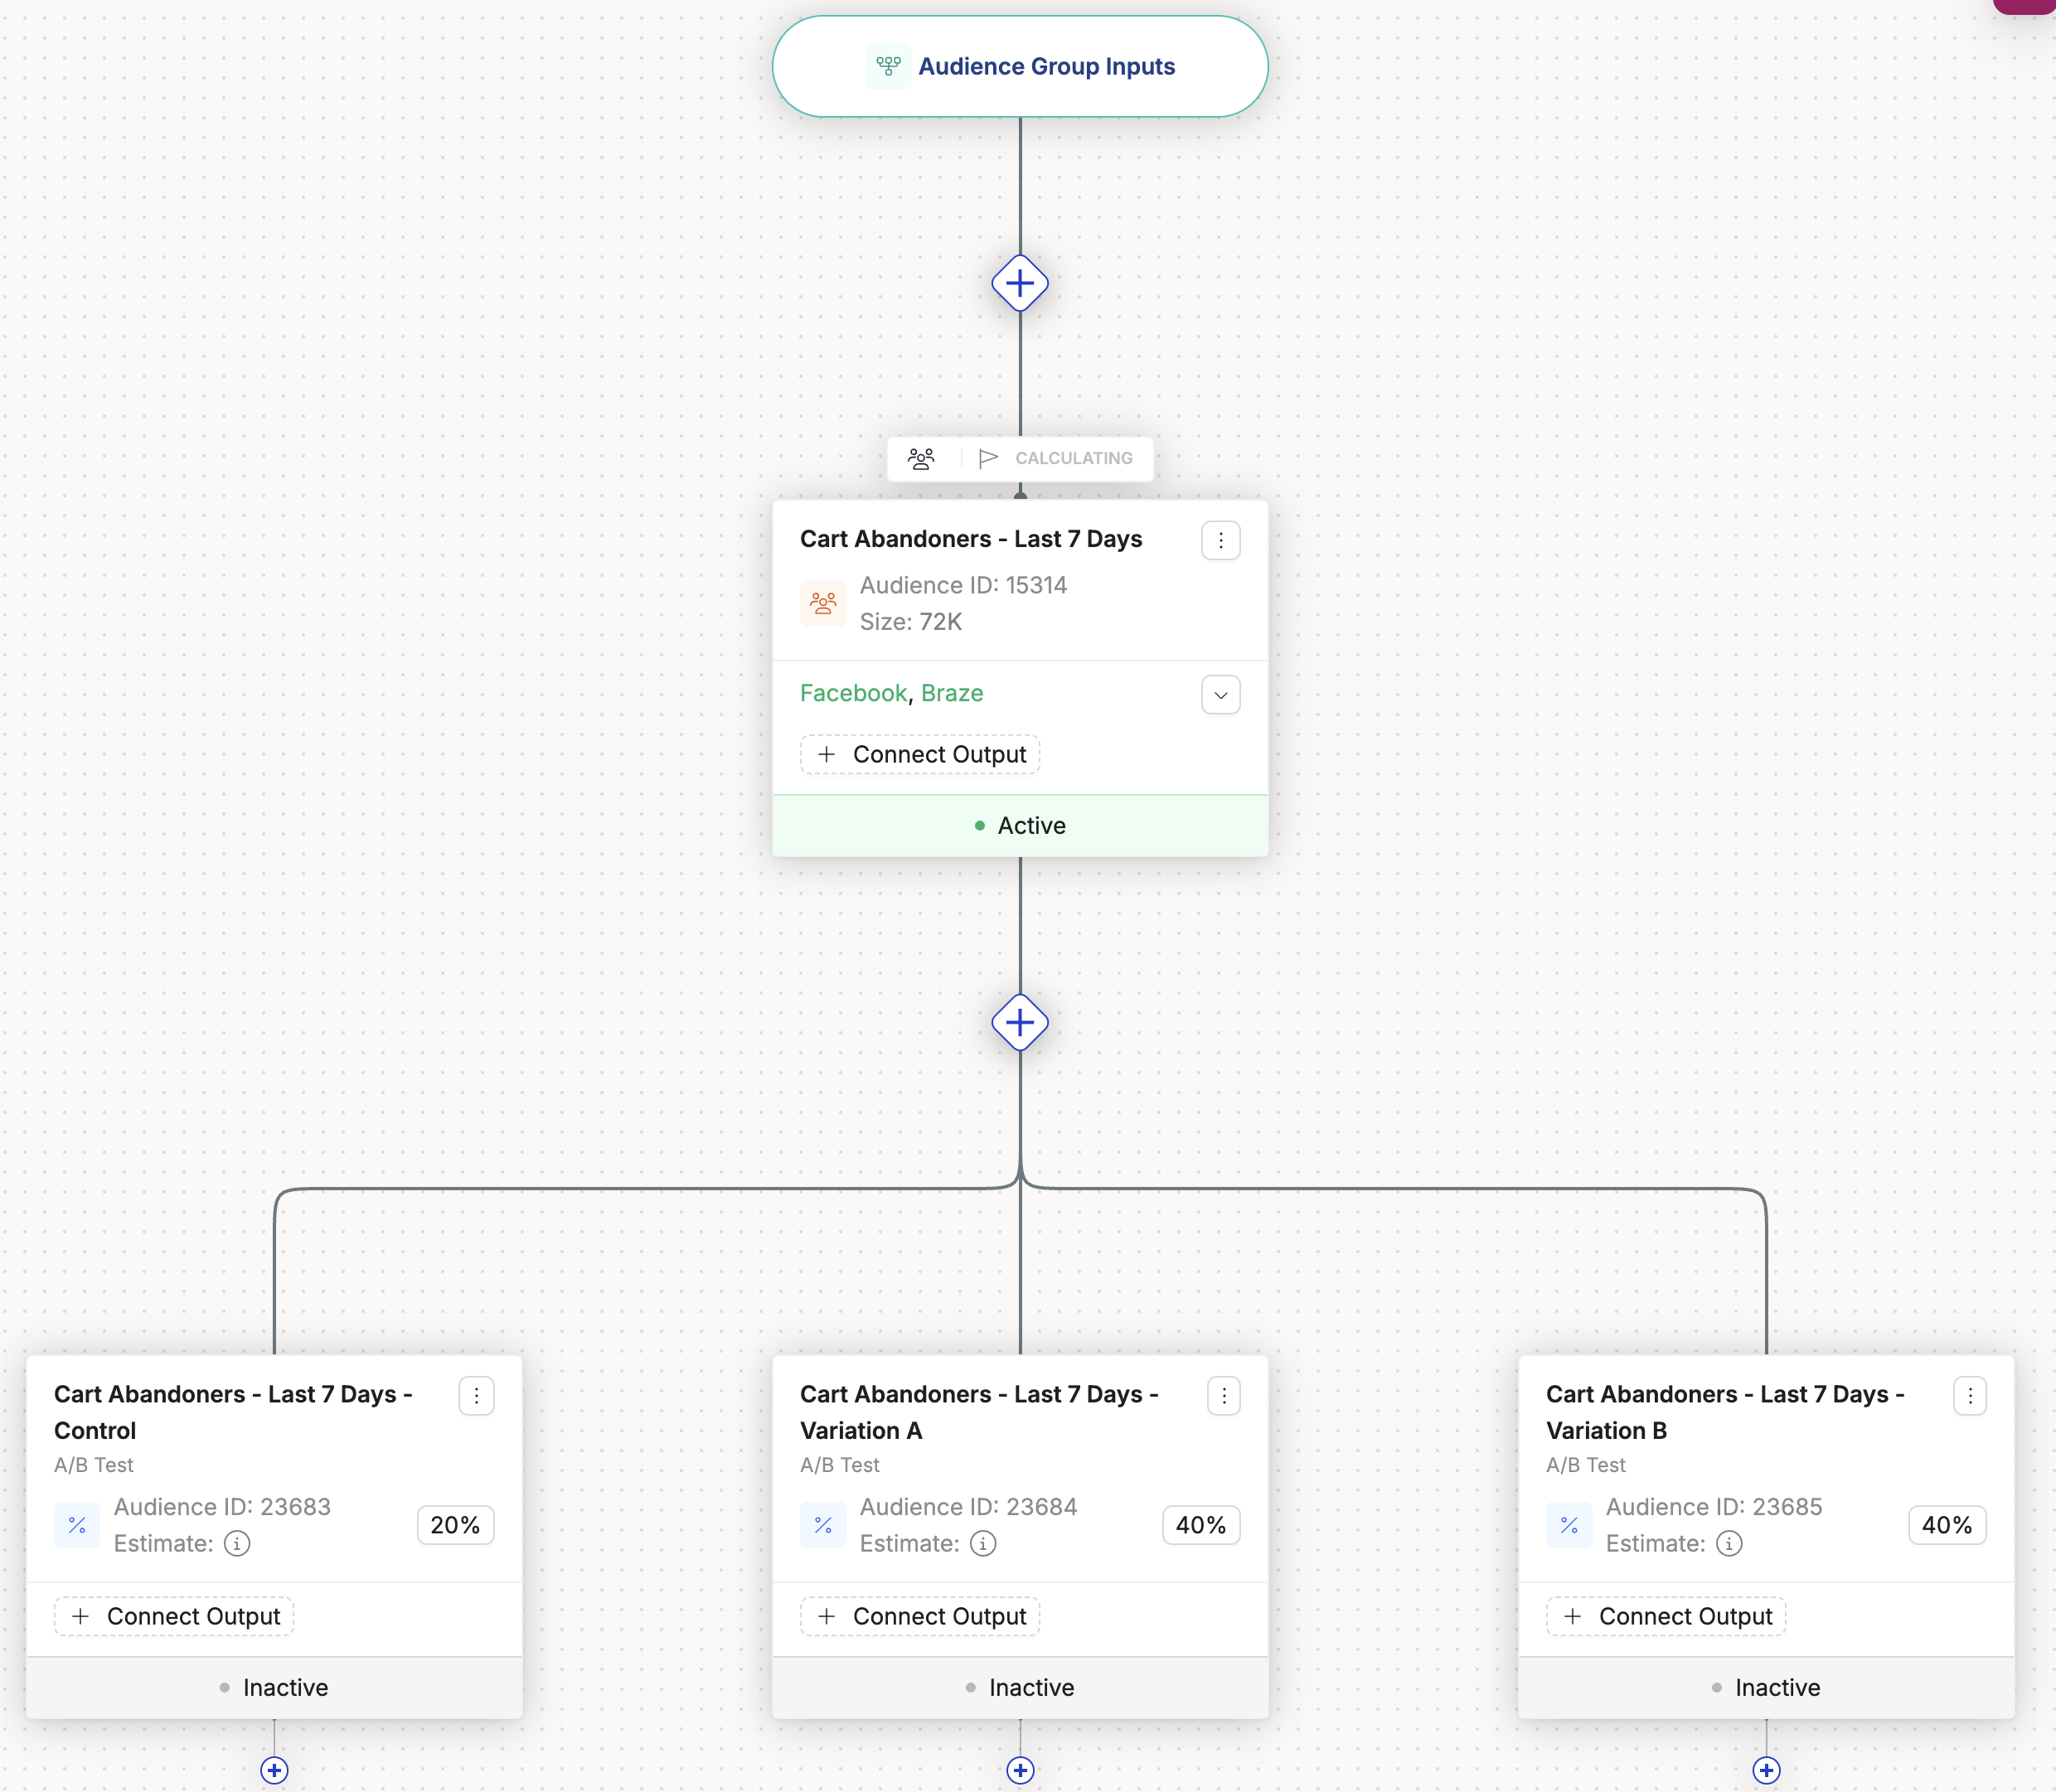
Connect Test Variations
Each variation, including the control group, is created as an individual audience with its own Connect Output action. You can connect different variations to different outputs or leave the control group unconnected. You can also connect the original audience before the A/B split to an output.
For detailed connection instructions, see Connect A/B Test Variations.
Manage an A/B Test
You can edit the source audience definition without removing the test. As audience membership changes, mParticle continues to assign qualifying users according to the percentages configured for the test.
To end an A/B test:
- In the Audience Group Editor, select the option to add a path directly above the test branches, then select Delete A/B Test.
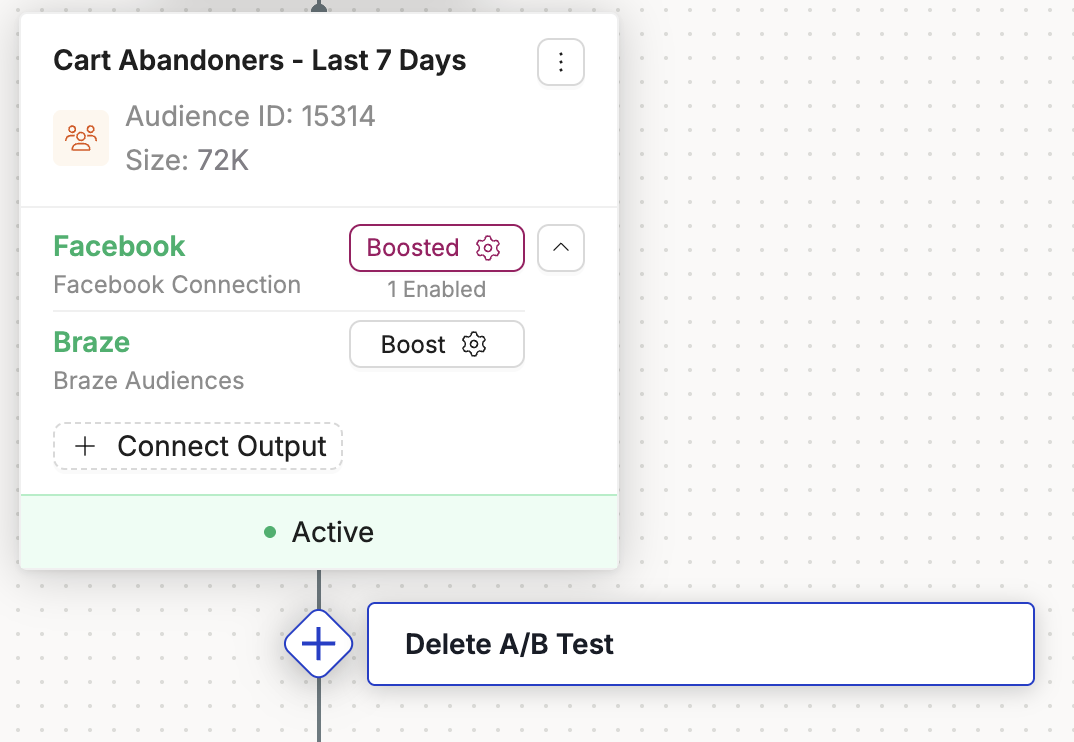
- Review the deletion warning, then select Delete.
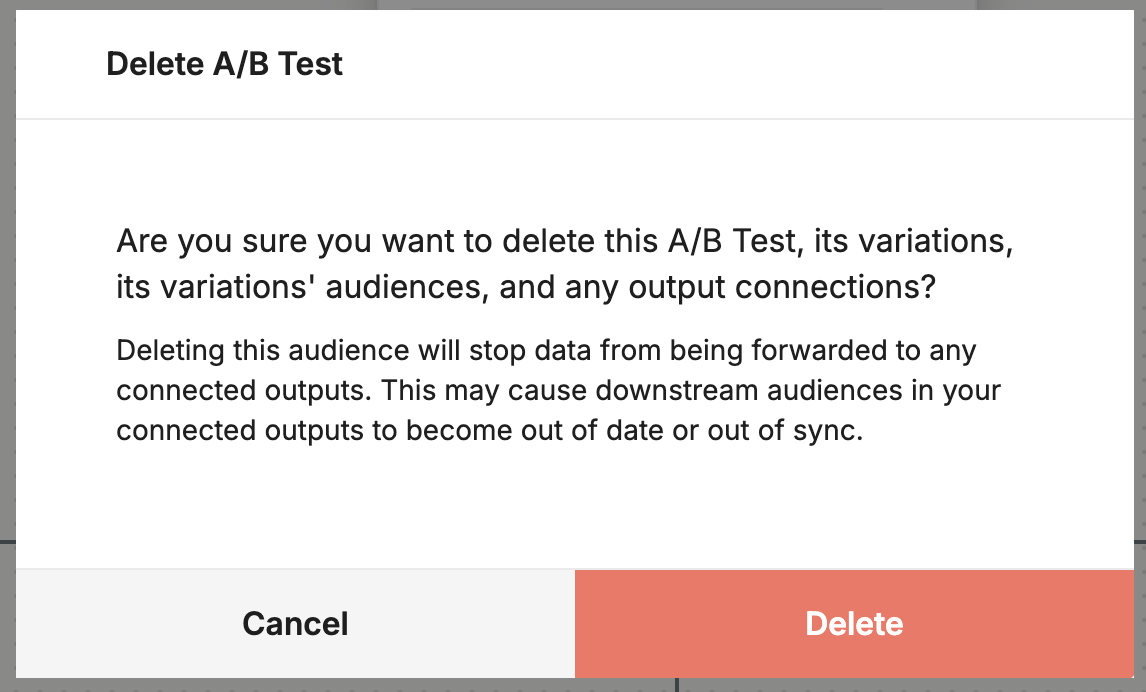
Deleting an A/B test also deletes its variations’ audiences and output connections. mParticle stops forwarding data to those outputs, which may leave their downstream audiences out of date or out of sync.
Audience Refresh Frequency
The Refresh Frequency setting determines how often mParticle updates audience membership. Choosing the right refresh frequency ensures your audience membership is as current as necessary for your business use case.
mParticle offers two types of refresh frequencies:
- Real-time – Audience membership is automatically updated as users either meet or no longer meet the audience criteria.
- One-time – Audience membership is calculated only a single time, and does not refresh.
One-time Audiences
Setting an audience’s Refresh Frequency to Once creates a one-time audience: an audience that calculates its membership a single time and does not refresh on a recurring basis. One-time audiences are a good fit for large audiences built on long-term, historical data, where real-time or repeated updates aren’t necessary.
A one-time audience expires 30 days after the scheduled start date. Before it expires, you can continue to connect it to new outputs, and mParticle sends its already-calculated membership to each new connection (see Connect an Audience).
After a one-time audience expires:
- Its size shows as 0.
- It can no longer be downloaded.
- You can’t add new connections or enable Match Boost.
- You can’t edit its environment, refresh frequency, or starting date.
An expired audience displays the Expired status (see Audience Statuses). Expiration does not remove membership that was already written to user profiles, so a real-time audience that references the one-time audience’s membership is unaffected when the one-time audience expires.
Key Limitations
- Refresh type is permanent – You cannot switch an audience from real-time to once after creation. Delta processing – Only changes (users who newly qualify or no longer qualify) for realtime audiences are forwarded to connected outputs. For one-time audiences there will be no delta processing, because one-time audiences are only calculated a single time.
- Historical data loads - Data from historical data replays will not be reflected in one-time audiences. You must clone the audience and re-activate it to have the data from the historical load be available for audience processing.
- Audience groups can’t combine realtime and one-time audiences — You can’t create both realtime and one-time audiences within the same audience group.
- One-time audiences can’t reference realtime audiences - You can’t add membership criteria to a one-time audience that refers to membership of a realtime audience. The reverse is allowed: a realtime audience can reference membership of a onetime audience.
- One-time audiences must be the root audience of a group - A one-time audience can only be the top-level (root) audience in its group. It can’t be nested as a child audience within an audience group.
Audience Preview
After defining your audience criteria, you can use the Preview tab to inspect a sample of users that match your current segmentation. Audience Preview helps validate audience composition before activation, reducing errors and improving targeting accuracy.
How to Use Audience Preview
- Navigate to the Preview tab in the audience editor.
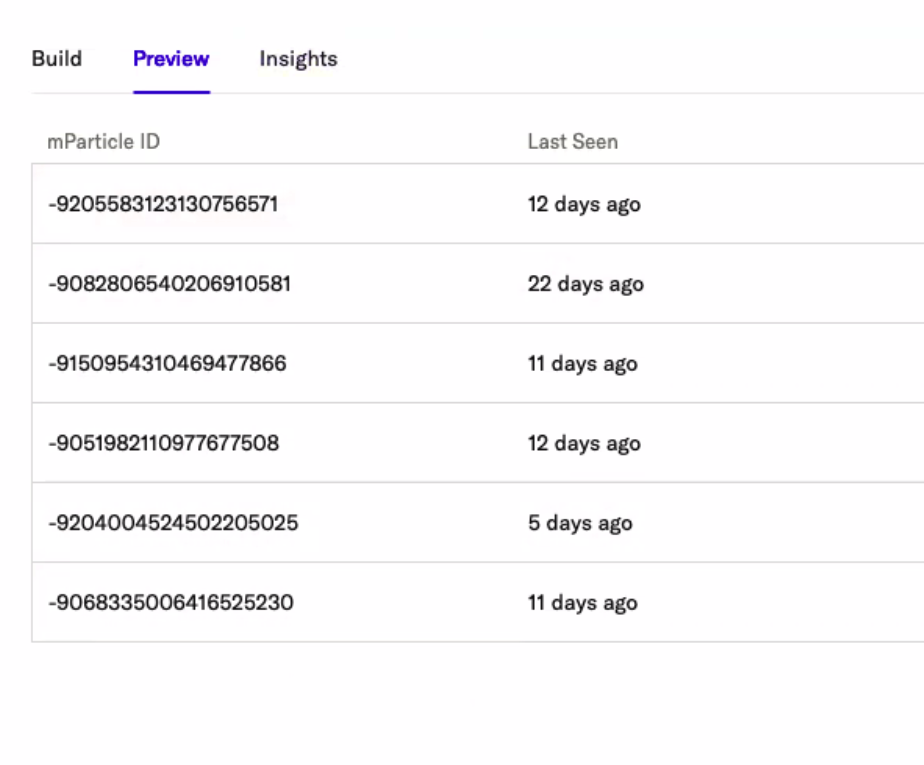
- View a list of sample users that meet your audience criteria:
-
Each row in the preview includes:
- mParticle ID – A unique identifier for each sampled user.
- Last Seen – The most recent interaction timestamp.
- Click on a user’s mParticle ID to open their User Profile for deeper insights.
Audience Preview enables quick validation of audience logic, ensuring that the right users are included before activation.
Audience Insights
Audience Insights helps you better understand changes in an audience’s membership, the potential reach of an audience, attribute distribution across your audiences, and how audiences overlap.
For composable audiences, you can access Audience Insights directly from the Audience Builder.
For real-time audiences, you can access Audience Insights directly from Audience Builder. If a real-time audience has an Active or Calculated status, you can also open a dedicated Audience Insights page by selecting the Insights icon in its row on the Audiences landing page:

To learn more about Audience Insights, see Audience Insights.
Precise vs. Estimated Audience Sizes
Throughout the Audience creation process, you will see both preliminary and precise audience sizes.
Preliminary Estimates
Preliminary estimates are displayed before the audience has been fully calculated, and are denoted with a ~ character throughout the Audiences feature. When an Audience is created or edited, for example, preliminary estimates are shown to give an approximate idea of audience size.
Precise Estimates
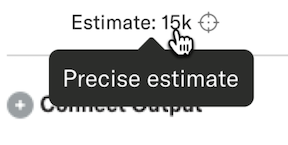
Once an audience definition has been defined, a precise estimate will be displayed for that audience, even if it has not been explicitly activated or connected. It can take up to 15 minutes for the precise estimate to finish calculating. Waiting for the precise estimate is a more efficient option than activating the audience just to get a sense of its size. Precise estimates will display a cross-hairs icon wherever they are displayed throughout the segmentation experience:
Activate an Audience Without Connecting
The Activate Without Connecting feature allows you to manually activate an audience so that it calculates audience membership and updates user profiles, even if no outputs are connected. Common use cases for activating an audience without connecting it include:
- API-Access – Membership in an activated audience appears in user profiles and is retrievable via the Profile API.
- Testing and Troubleshooting – Before sending an audience to a downstream integration (e.g., Facebook or Braze), you may want to verify its size, composition, and updates to ensure accuracy and confidence in segmentation.
- Separation of Activation and Connection – You do not have to delete an audience to disconnect it from an output. This makes audiences more flexible and versatile, as you can preserve their definitions and criteria through the process of connecting and disconnecting outputs.
- Deactivate without Deleting – If an audience is no longer needed but it may be in the future, you can manually Deactivate it in the UI without deleting it. This preserves the audience definition for future use while stopping membership calculation and preventing further billing.
Audience Statuses
Audiences can exist in four states:
- Inactive – The default state when an audience is first created.
- Active – A manually activated audience, either through this feature or by connecting to an output. An audience with this state is actively calculating/processing audience membership changes.
- Calculated – A state where an audience is automatically activated by mParticle because other audiences depend on it. An audience with this state is actively calculating/processing audience membership changes. Calculated audiences are not charged from a billing perspective.
- Expired – Applies only to one-time audiences. A one-time audience automatically expires 30 days after the scheduled start date. After it expires, its size shows as 0, it can no longer be downloaded or connected to new outputs, and you can’t enable Match Boost or edit its environment, refresh frequency, or starting date. For more information, see one-time audiences.
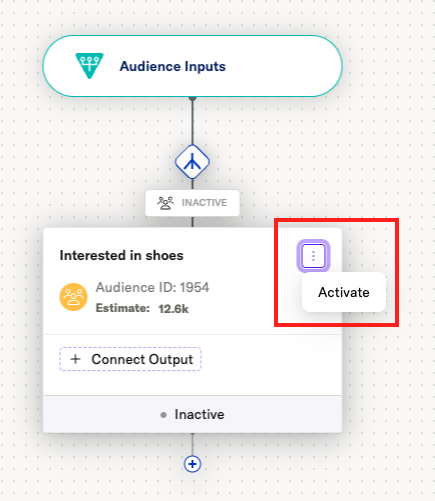
Activate an audience: To activate an audience after it has been created (but before any outputs have been connected), click the three vertical dots in the top right of the audience tile, then select Activate.
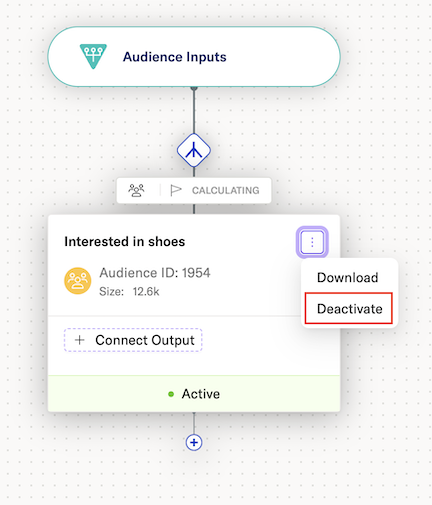
Deactivate an audience: To deactivate an audience once it is activated, click the three vertical dots in the top right of the audience tile, then select Deactivate.
Considerations when activating audiences
- Billing Impact: Once an audience is activated and has an Active status, billing begins regardless of whether it is connected to an output or used for any specific action.
- A/B Audience Billing: Only audiences with an Active status consume a real-time credit, and an A/B test uses one credit total, no matter how many variations are active.
- Sibling cascade: If an audience in a branch moves to Active status, mParticle will automatically transition any dependent sibling and parent audiences into the Calculated state.
Activate an Audience in a Campaign
Once you have created an Audience that you want to forward to an external tool for use in a campaign, click the Connect Output button in the Audience tile, then follow the steps to connect that audience to any of your connected outputs.
Main Criteria Types
You can build criteria based on two main sources of data:
Events
Event criteria check for specific events and their properties, and their availability is subject to the data retention policy of your account. Within the new criteria option in the audience builder, the following options create event-based criteria:
EventsEcommerceCrashesInstallsUninstallsSessionsUpgradesScreen views
User Profiles
These criteria check your active user profiles, and their availability is subject to the user profile retention policies of your account. Within the new criteria option in the audience builder, the following options create profile-based criteria:
- Users: Access user profile information such as user attributes, calculated attributes, current audience memberships, consent state, location, etc.
- User Predictions: Predictive Attributes that you have defined and generated for your users.
- Attribution: Access user install and uninstall information to build criteria based on the attributed
campaignandpublisher.
Circular references in audience membership conditions
You can add criteria to an audience definition based on audience membership. For example, if you have two audiences, A and B, you can specify that if a user is a member of audience A, they should be included in audience B.
However, the Audience Builder will not allow you to add audience membership-based criteria that results in a circular reference. For example, imagine the following scenario:
- You’re editing an audience called High-Value Shoppers.
- You want to add the audience membership condition: “User is a member of Holiday Campaign Responders”.
- But Holiday Campaign Responders already references Mobile App Users, and Mobile App Users includes High-Value Shoppers.
In this case, High-Value Shoppers ends up referencing itself indirectly through the other two audiences, making the definition invalid.
To prevent this, the Audience Builder would exclude Holiday Campaign Responders from the list of audiences in the dropdown menu. If you notice that some of your audiences are not displayed when creating membership-based conditions, this could be why.
Data Types and Matching Rules
Audience criteria can be created with several different data types, each with its own matching rules.
Strings
When building audiences based on string attributes, several case-insensitive matching rules can be applied:
- Contains / Does Not Contain: Matches substrings. For example,
"blue"matches both"blue"and"blue shirt". - Exact Match / Does Not Match: Requires the entire string to match. For example,
"blue"matches"blue", but not"blue shirt". - Pattern: Allows wildcard matching.
*represents any number of characters, and?represents any single character. For example,"bl?e"or"b*e"would both match"blue". - Includes / Does Not Include: Matches an exact value within a list. For example, specifying
"Chicago"in a list of movies returns"Chicago (2002)"and"Chicago (1927)", but not"Chicago Cubs". - Partial Match: The inverse of Includes. For example, specifying
"Chicago"would return all movies with"Chicago"in the title.
Date-Based Criteria
Filters based on fixed calendar dates. For example, events occurring after 09/12/2018. Date-based criteria are defined in UTC and are not relative to when the audience is calculated:
- Before: Excludes the specified date. For example, “Before September 9, 2018” includes events up to 11:59 PM UTC on September 8.
- After: Includes the specified date. For example, “After September 9, 2018” includes events from 12:00 AM UTC on September 9.
- On Date: Covers events from 12:00 AM to 11:59 PM UTC on the specified date.
- Between Dates: Includes events from the start of the first date to the end of the second date.
Recency-Based Criteria
Defines a period relative to the current time. For example, users active within the last 7 days. Recency-based criteria select events occurring within a timeframe relative to ‘now’.
- For example, if calculated at 1:00 PM on September 9, 2018, a recency filter for the last 7 days includes events between 1:00 PM on September 3 and 1:00 PM on September 9.
Attribution
Attribution criteria segment users based on campaign interactions, such as app installs or re-engagements.
- Profile Criteria: Select Attribution, then choose Install or Uninstall to filter based on campaign and publisher fields from attribution events.
- Event Criteria: Select Events > Attribution to use install or engagement events, filtering by event attributes. This allows you to select any information included with the event as
custom_attributes.
Note: All event criteria are subject to audience event retention limits.
Identity
Identity criteria segment users based on their stored identities. You can test for the existence of a specific identity or apply string-based logic. These criteria are scoped to the workspace in which the audience is created. For example, if your account has three workspaces, an audience in one workspace only includes users active in that workspace.
Location
Location criteria allow segmentation based on geographic information.
- Equals: Filter users in a specific city, state, zip code, or DMA (Designated Market Area), based on IP geolocation.
- Within: Filter users within a set distance of a global city using latitude and longitude coordinates.
Cart
For ecommerce events, you can target users who added items to their cart but did not complete a purchase.
- Cart Abandonment: Select New Criteria > Ecommerce > Shopping - Cart Level > Cart Abandonment to define this segment.
- Specify the time period to wait without a purchase before including users in this audience.
Attribute Key
Use Exists or Not Exists to check for the presence of an attribute.
- For example, User Attribute: Gender EXISTS evaluates as true for both
Gender = "Female"andGender = undefined.
Additional Audience Features
Hybrid Audiences
Hybrid Audiences allows you to combine a composable audience that runs in your warehouse with real-time criteria in the Audience Builder. At a high level, you start with a composable audience that has been enabled for Hybrid Audiences, then reference that audience as part of your real-time criteria.
When a composable audience is enabled for Hybrid Audiences, mParticle matches each warehouse user to their mParticle profile using the identities configured in the underlying data model (such as email or customer ID). For each user where a match is found, mParticle records that user as a member of the audience on their profile. This is what makes composable audience membership available as a criterion in the Audience Builder.
Before you begin, make sure that:
- Your composable audience is built on a user data model where Enable this Data Model for Hybrid Audiences is turned on. This tells mParticle which identities to use when looking up mParticle profiles for warehouse users.
- The composable audience has Audience Membership Settings set to Enable for Hybrid Audiences, and the audience has been activated so that membership is written to user profiles.
To create a hybrid audience in the Audience Builder:
- Follow the steps above to create a real-time audience and open the Audience Builder.
- Click Add criteria, then choose Users to add profile-based criteria.
- In the criteria editor, select Audience Membership and choose the composable audience you want to reference. This limits your audience to users who are also members (or not) of that composable audience.
- Add additional criteria as needed, such as recent events, recency windows, or user attributes, to refine your real-time logic.
- Click Done when you have finished adding criteria, then continue configuring and activating the audience as you would for any other real-time audience.
Hybrid audiences you create this way are activated and connected to outputs in the same way as other real-time audiences. You can learn more about hybrid audiences in the Composable Audiences Overview.
Auto-complete
As you define your audience criteria, a list of suggested matching values will appear based on what you’ve entered.
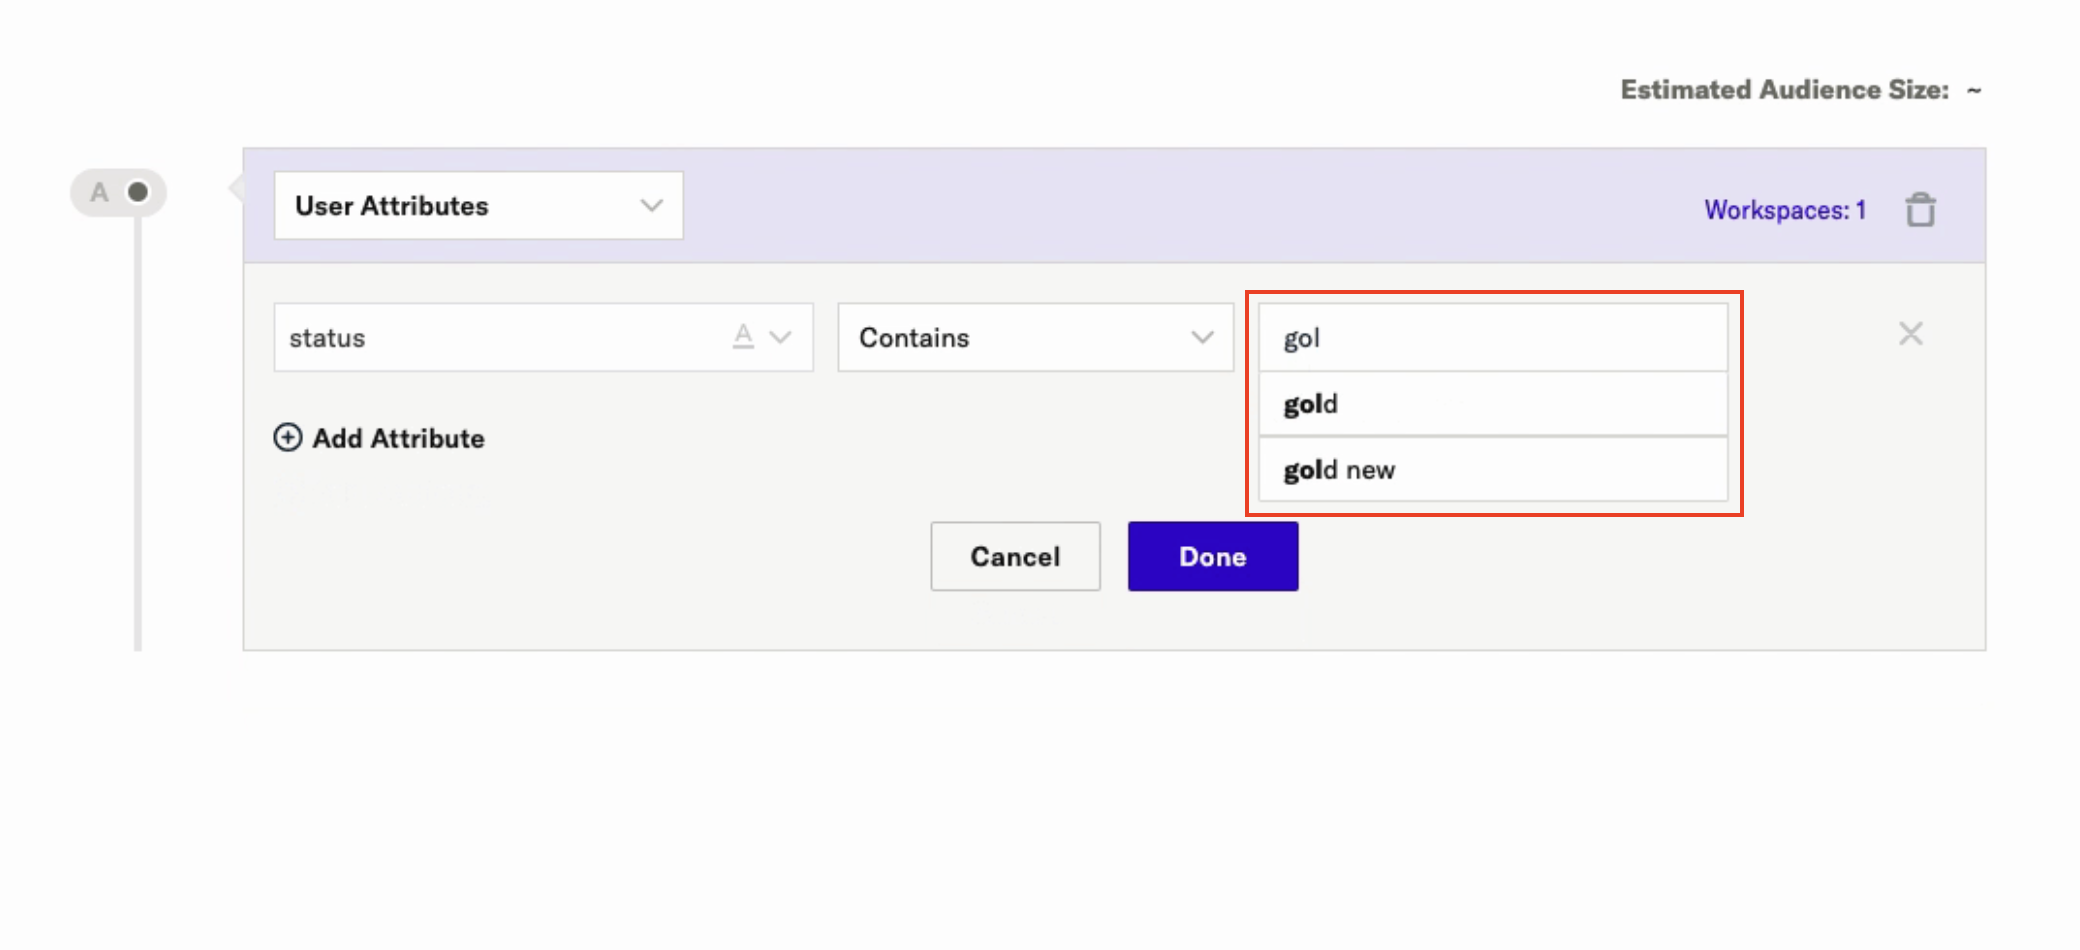
This feature works both when building new audiences and fine-tuning existing ones, helping you save time, reduce manual effort, and improves accuracy. To use it, you must have one of the following standard Roles: User, Admin, Audiences-only, Support, or Admin+Compliance. Alternatively, you can create a Custom Role with any of the following tasks: audiences:draft, audiences:edit, catalog, or audiences.
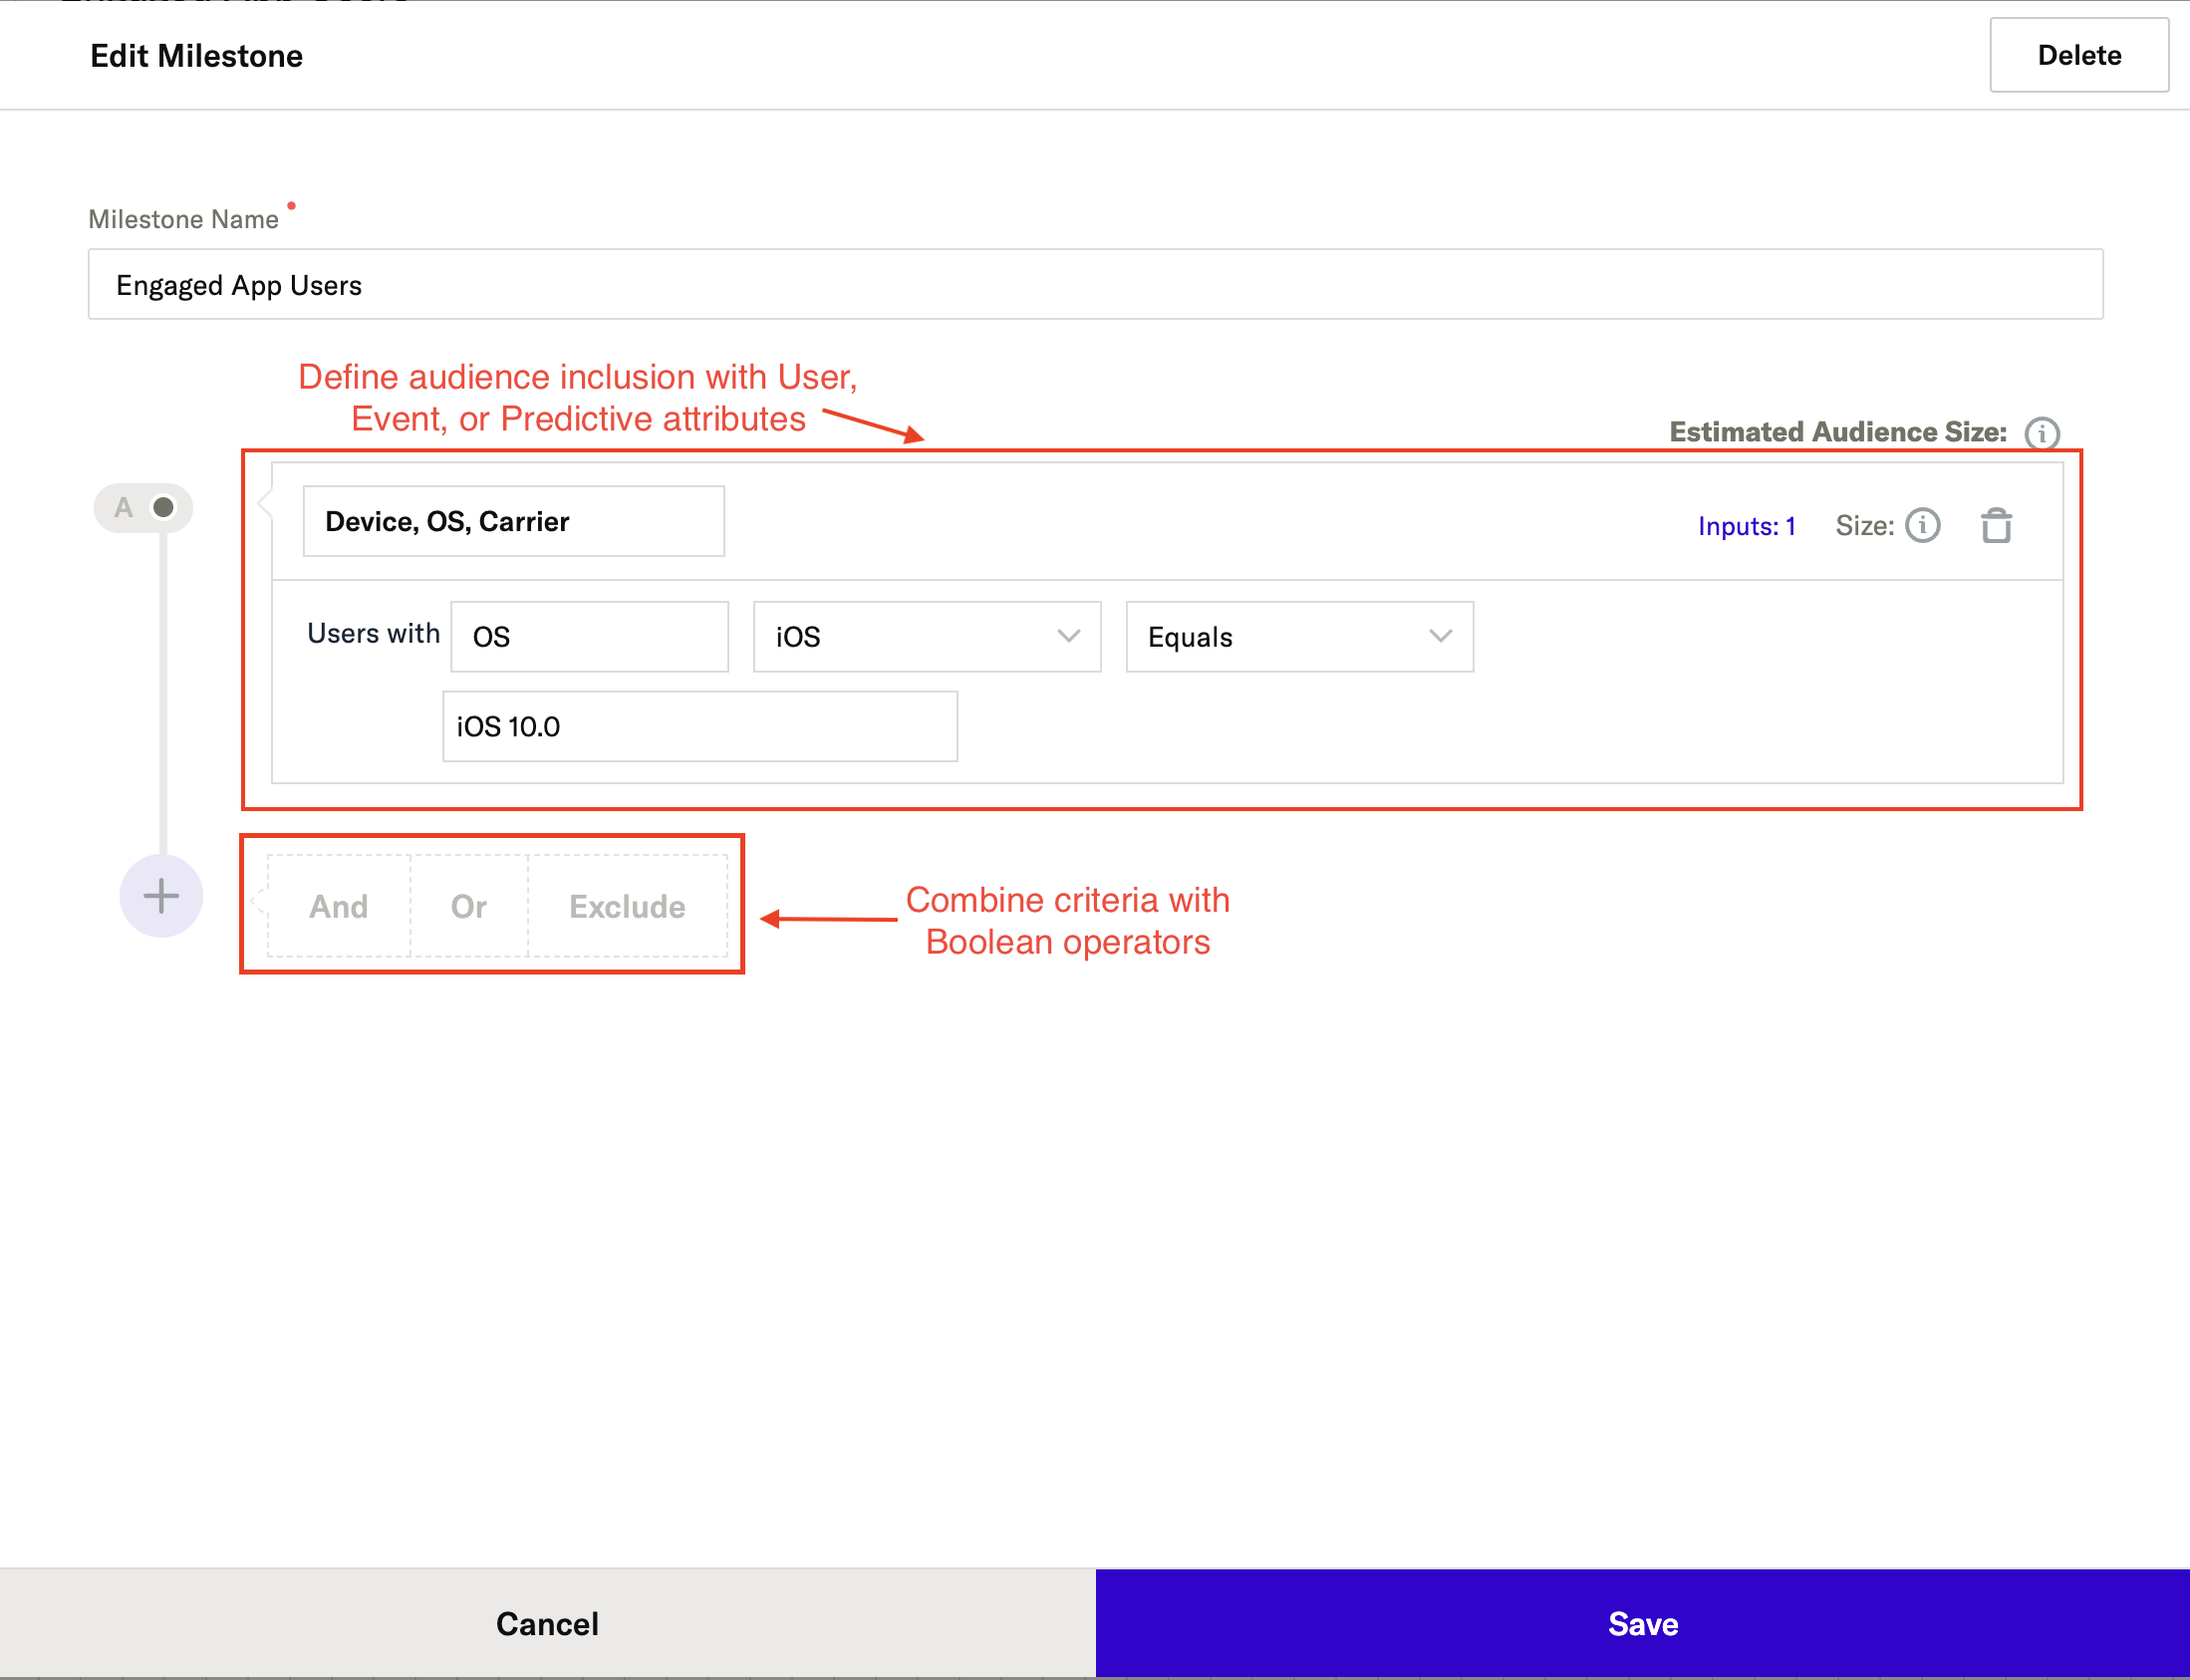
Boolean operators
Once you have added criteria, you can use the Boolean operators And, Or, and Exclude to create logical relationships with subsequent criteria.
Audience Environment Considerations
Be mindful of your selected audience environment:
- Use Production for real customer data to prevent test data from overwriting profiles in partner systems.
- Ensure parent and child audiences share the same environment. If environments differ, child audiences will not inherit users from their parent.
Audiences in Development display a badge in the Audience Group Editor, while Production audiences do not.
By following these steps and best practices, you can build and activate audiences that align with your business objectives, enabling more targeted user engagement and monetization strategies.
Was this page helpful?
- Last Updated: October 8, 2026