Developers
API References
Data Subject Request API
Data Subject Request API Version 1 and 2
Data Subject Request API Version 3
Platform API
Key Management
Platform API Overview
Accounts
Apps
Audiences
Calculated Attributes
Data Points
Feeds
Field Transformations
Services
Users
Workspaces
Warehouse Sync API
Warehouse Sync API Overview
Warehouse Sync API Tutorial
Warehouse Sync API Reference
Data Mapping
Warehouse Sync SQL Reference
Warehouse Sync Troubleshooting Guide
ComposeID
Warehouse Sync API v2 Migration
Audit Logs API
Calculated Attributes Seeding API
Bulk Profile Deletion API Reference
Custom Access Roles API
Household Reach API Reference
Data Planning API
Pixel Service
Profile API
Events API
mParticle JSON Schema Reference
IDSync
Client SDKs
AMP
AMP SDK
Android
Initialization
Configuration
Network Security Configuration
Event Tracking
User Attributes
IDSync
Screen Events
Commerce Events
Location Tracking
Media
Kits
Application State and Session Management
Data Privacy Controls
Error Tracking
Opt Out
Push Notifications
WebView Integration
Logger
Preventing Blocked HTTP Traffic with CNAME
Workspace Switching
Linting Data Plans
Troubleshooting the Android SDK
API Reference
Upgrade to Version 5
Upgrade to Version 6
Cordova
Cordova Plugin
Identity
Direct Url Routing
Direct URL Routing FAQ
Web
Android
iOS
iOS
Workspace Switching
Initialization
Configuration
Event Tracking
User Attributes
IDSync
Screen Tracking
Commerce Events
Location Tracking
Media
Kits
Application State and Session Management
Data Privacy Controls
Error Tracking
Opt Out
Push Notifications
Webview Integration
Upload Frequency
Preventing Blocked HTTP Traffic with CNAME
Linting Data Plans
Troubleshooting iOS SDK
Social Networks
iOS 14 Guide
iOS 15 FAQ
iOS 16 FAQ
iOS 17 FAQ
iOS 18 FAQ
API Reference
Upgrade to Version 7
Upgrade to Version 9
.NET MAUI
Getting Started
Identity
React Native
Getting Started
Identity
Unity
Upload Frequency
Getting Started
Opt Out
Initialize the SDK
Event Tracking
Commerce Tracking
Error Tracking
Screen Tracking
Identity
Location Tracking
Session Management
Web
Initialization
Configuration
Content Security Policy
Event Tracking
User Attributes
IDSync
Page View Tracking
Commerce Events
Location Tracking
Media
Kits
Application State and Session Management
Data Privacy Controls
Error Tracking
Opt Out
Custom Logger
Persistence
Native Web Views
Self-Hosting
Multiple Instances
Web SDK via Google Tag Manager
Preventing Blocked HTTP Traffic with CNAME
Facebook Instant Articles
Troubleshooting the Web SDK
Browser Compatibility
Linting Data Plans
API Reference
Upgrade to Version 3 of the SDK
Alexa
Quickstart
Android
Overview
Step 1. Create an input
Step 2. Verify your input
Step 3. Set up your output
Step 4. Create a connection
Step 5. Verify your connection
Step 6. Track events
Step 7. Track user data
Step 8. Create a data plan
Step 9. Test your local app
iOS Quick Start
Overview
Step 1. Create an input
Step 2. Verify your input
Step 3. Set up your output
Step 4. Create a connection
Step 5. Verify your connection
Step 6. Track events
Step 7. Track user data
Step 8. Create a data plan
Python Quick Start
Step 1. Create an input
Step 2. Create an output
Step 3. Verify output
Server SDKs
Node SDK
Go SDK
Python SDK
Ruby SDK
Java SDK
Guides
Partners
Introduction
Outbound Integrations
Outbound Integrations
Firehose Java SDK
Inbound Integrations
Compose ID
Data Hosting Locations
Glossary
Migrate from Segment to mParticle
Migrate from Segment to mParticle
Migrate from Segment to Client-side mParticle
Migrate from Segment to Server-side mParticle
Segment-to-mParticle Migration Reference
Rules Developer Guide
API Credential Management
The Developer's Guided Journey to mParticle
Guides
Composable Audiences
Composable Audiences Overview
User Guide
User Guide Overview
Warehouse Setup
Warehouse Setup Overview
Audience Setup
Frequently Asked Questions
Customer 360
Overview
User Profiles
Overview
User Profiles
Household Reach
Calculated Attributes
Calculated Attributes Overview
Using Calculated Attributes
Create with AI Assistance
Calculated Attributes Reference
Predictions
Predictions Overview
What's Changed in the New Predictions UI
View and Manage Predictions
Predict Future Behavior
Future Behavior Predictions Overview
Create Future Behavior Prediction
Manage Future Behavior Predictions
Create an Audience with Future Behavior Predictions
Identity
Identity Dashboard
Identity Logs
Getting Started
Create an Input
Start capturing data
Connect an Event Output
Create an Audience
Connect an Audience Output
Transform and Enhance Your Data
Platform Guide
Billing
Usage and Billing Report
The New mParticle Experience
The new mParticle Experience
The Overview Map
Observability
Observability Overview
Observability User Guide
Observability Troubleshooting Examples
Observability Span Glossary
Platform Settings
Key Management
Audit Logs
Platform Configuration
Event Forwarding
Event Match Quality Dashboard
Notifications
System Alerts
Trends
Introduction
Data Retention
Data Catalog
Connections
Activity
Data Plans
Live Stream
Filters
Consent Filters
Rules
Blocked Data Backfill Guide
Tiered Events
mParticle Users and Roles
Analytics Free Trial
Troubleshooting mParticle
Usage metering for value-based pricing (VBP)
IDSync
IDSync Overview
Use Cases for IDSync
Components of IDSync
Store and Organize User Data
Identify Users
Default IDSync Configuration
Profile Conversion Strategy
Profile Link Strategy
Profile Isolation Strategy
Best Match Strategy
Aliasing
Segmentation
Audiences
Audiences Overview
Create an Audience
Connect an Audience
Manage Audiences
Audience Insights
Audience Sharing
Match Boost
Inclusive & Exclusive Audiences (Early Access)
Inclusive & Exclusive Audiences Overview
Using Logic Blocks in Audiences
Combining Inclusive and Exclusive Audiences
Inclusive & Exclusive Audiences FAQ
Audience Expansion
Predictive Audiences
Predictive Audiences Overview
Using Predictive Audiences
mParticle Agent
Overview
Explore Your Data
Build Audiences
Create Predictions
Data and Privacy
mParticle Agent FAQ
Analytics
Introduction
Core Analytics (Beta)
Setup
Sync and Activate Analytics User Segments in mParticle
User Segment Activation
Welcome Page Announcements
Settings
Project Settings
Roles and Teammates
Organization Settings
Global Project Filters
Portfolio Analytics
Analytics Data Manager
Analytics Data Manager Overview
Events
Event Properties
User Properties
Revenue Mapping
Export Data
UTM Guide
Analyses
Analyses Introduction
Segmentation: Basics
Getting Started
Visualization Options
For Clauses
Date Range and Time Settings
Calculator
Numerical Settings
Segmentation: Advanced
Assisted Analysis
Properties Explorer
Frequency in Segmentation
Trends in Segmentation
Did [not] Perform Clauses
Cumulative vs. Non-Cumulative Analysis in Segmentation
Total Count of vs. Users Who Performed
Save Your Segmentation Analysis
Export Results in Segmentation
Explore Users from Segmentation
Funnels: Basics
Getting Started with Funnels
Group By Settings
Conversion Window
Tracking Properties
Date Range and Time Settings
Visualization Options
Interpreting a Funnel Analysis
Funnels: Advanced
Group By
Filters
Conversion over Time
Conversion Order
Trends
Funnel Direction
Multi-path Funnels
Analyze as Cohort from Funnel
Save a Funnel Analysis
Explore Users from a Funnel
Export Results from a Funnel
Saved Analyses
Manage Analyses in Dashboards
Query Builder
Data Dictionary
Query Builder Overview
Modify Filters With And/Or Clauses
Query-time Sampling
Query Notes
Filter Where Clauses
Event vs. User Properties
Group By Clauses
Annotations
Cross-tool Compatibility
Apply All for Filter Where Clauses
Date Range and Time Settings Overview
User Attributes at Event Time
Understanding the Screen View Event
User Aliasing
Dashboards
Dashboards––Getting Started
Manage Dashboards
Dashboard Filters
Organize Dashboards
Scheduled Reports
Favorites
Time and Interval Settings in Dashboards
Query Notes in Dashboards
Analytics Resources
The Demo Environment
Keyboard Shortcuts
User Segments
Data Privacy Controls
Data Subject Requests
Default Service Limits
Feeds
Import Data with CSV Files
Import Data with CSV Files
CSV File Reference
SFTP Credentials
Glossary
Video Index
Analytics (Deprecated)
Identity Providers
Single Sign-On (SSO)
Setup Examples
Introduction
Developer Docs
Introduction
Integrations
Introduction
Rudderstack
Google Tag Manager
Segment
Data Warehouses and Data Lakes
Advanced Data Warehouse Settings
AWS Kinesis (Snowplow)
AWS Redshift (Define Your Own Schema)
AWS S3 Integration (Define Your Own Schema)
AWS S3 (Snowplow Schema)
BigQuery (Snowplow Schema)
BigQuery Firebase Schema
BigQuery (Define Your Own Schema)
GCP BigQuery Export
Snowflake (Snowplow Schema)
Snowplow Schema Overview
Snowflake (Define Your Own Schema)
Developer Basics
Aliasing
Integrations
24i
Event
ABTasty
Audience
Aarki
Audience
AdChemix
Event
Actable
Feed
Adobe Marketing Cloud
Cookie Sync
Platform SDK Events
Server-to-Server Events
AdMedia
Audience
Adobe Audience Manager
Audience
Adobe Campaign Manager
Audience
Adobe Experience Platform
Event
AdPredictive
Feed
AgilOne
Event
Adobe Target
Audience
Algolia
Event
Amazon Kinesis
Event
Amazon Redshift
Data Warehouse
Amazon SNS
Event
Amazon SQS
Event
Amobee
Audience
Antavo
Feed
Anodot
Event
Apptimize
Event
Apteligent
Event
Apptentive
Event
Bing Ads
Event
Bluecore
Event
Bidease
Audience
Bluedot
Feed
Branch S2S Event
Event
Bugsnag
Event
Cadent
Audience
Census
Feed
comScore
Event
Conversant
Event
Crossing Minds
Event
Custom Feed
Custom Feed
Datadog
Event
Databricks
Data Warehouse
Didomi
Event
Eagle Eye
Audience
Edge226
Audience
Emarsys
Audience
Epsilon
Event
Everflow
Audience
Google Analytics for Firebase
Event
Facebook Offline Conversions
Event
Flurry
Event
Flybits
Event
ForeSee
Event
FreeWheel Data Suite
Audience
Friendbuy
Event
Google Ad Manager
Audience
Google Analytics
Event
Google Analytics 4
Event
Google BigQuery
Audience
Data Warehouse
Google Enhanced Conversions
Event
Google Marketing Platform
Audience
Cookie Sync
Event
Google Marketing Platform Offline Conversions
Event
Google Pub/Sub
Event
Google Tag Manager
Event
Heap
Event
Herow
Feed
Hightouch
Feed
Hyperlocology
Event
Ibotta
Event
ID5
Kit
Impact
Event
InMarket
Audience
Inspectlet
Event
Intercom
Event
ironSource
Audience
Kafka
Event
Kissmetrics
Event
Kubit
Event
LaunchDarkly
Feed
LifeStreet
Audience
LiveLike
Event
Liveramp
Audience
Localytics
Event
MadHive
Audience
mAdme Technologies
Event
Marigold
Audience
MediaMath
Audience
Mediasmart
Audience
Microsoft Ads
Microsoft Ads Audience Integration
Microsoft Azure Event Hubs
Event
Mintegral
Audience
Monetate
Event
Movable Ink
Event
Movable Ink - V2
Event
Multiplied
Event
Nami ML
Feed
Nanigans
Event
NCR Aloha
Event
Neura
Event
OneTrust
Event
Oracle BlueKai
Event
Paytronix
Feed
Persona.ly
Audience
Personify XP
Event
Plarin
Event
Primer
Event
Qualtrics
Event
Quantcast
Event
Rakuten
Event
Regal
Event
Awin
Event
Microsoft Azure Blob Storage
Event
Reveal Mobile
Event
RevenueCat
Feed
Salesforce Mobile Push
Event
Scalarr
Event
SFTP
Audience
Shopify
Custom Pixel
Feed
SimpleReach
Event
Singular-DEPRECATED
Event
Skyhook
Event
Slack
Event
Smadex
Audience
SmarterHQ
Event
Snapchat Conversions
Event
Snowflake
Audience
Data Warehouse
Splunk MINT
Event
Snowplow
Event
StartApp
Audience
Talon.One
Audience
Event
Feed
Loyalty Feed
Tapad
Audience
Taplytics
Event
Tapjoy
Audience
Taptica
Audience
Teak
Audience
The Trade Desk
Audience
Cookie Sync
Event
Ticketure
Feed
Triton Digital
Audience
TUNE
Event
Vibe
Audience
Valid
Event
Vkontakte
Audience
Webhook
Event
Webtrends
Event
Wootric
Event
White Label Loyalty
Event
Vungle
Audience
Xandr
Audience
Cookie Sync
Yotpo
Feed
YouAppi
Audience
Yahoo (formerly Verizon Media)
Audience
Cookie Sync
Audience Insights
Audience Insights provide visibility into how an audience’s membership changes over time, an audience’s potential reach, how enrichment changes reach, the distribution of attributes in an audience, and how much an audience overlaps with other audiences in your account. These insights can help improve the users you’re targeting to ensure your audience meets your business goals.
You can open Audience Insights from either the Audiences landing page or Audience Builder:
- From the Audience Builder, click the Insights tab. You can view audience insights for real-time and composable audiences in the Audience Builder.
- From the Audiences landing page, click the Insights icon on an audience’s row to open a dedicated Audience Insights page. This is only available for real-time audiences with an Active or Calculated status.

Analysis status
At the top of Audience Insights, you can find an overview of when the insights were last updated, the sample size used to calculate the different metrics, and how much historical data is available.
-
Insights last update (UTC): The timestamp of the most recent analysis run. Insights refresh on a schedule rather than in real time:
- Active audiences: Recalculations happen automatically once per day.
- Inactive audiences: Recalculations happen whenever you modify the audience.
-
Analysis results: The precision of the metrics shown.
- Until you activate an audience, insights are estimates based on a small sample of your audience data and are labeled Estimate.
- Once you activate the audience, or save it without activating it, insights are regenerated using a larger sample size and are labeled Precise.
- Historic data: How many days of historical data are available for the charts in Audience Insights. Longer date ranges and the Audience Health forecast become more meaningful as more history accumulates.
Historical data accumulates from the last time you edited the audience definition: each change to the membership criteria in the audience definition resets the historical data. For example, if you activate an audience and leave it unchanged for 30 days, Historic data shows 30 days and the insights display a 30-day historical trend. If you edit the criteria on day 31, metrics are calculated from that point forward. Inactive audiences don’t accumulate historical data, but you can still view insights based on the current definition.
Audience Health
The Audience Health section allows you to examine how your audience membership changes over time: how large the audience is, how fast it’s growing or shrinking, and where it’s likely headed next.
You can refer to this section to answer questions such as:
- Is this audience growing, stable, or declining in size?
- How many users join and leave the audience in a typical week?
- At what rate is the audience losing members, and is this rate changing over time?
- What size should I expect this audience to be over the coming weeks?
Audience Size
The Audience Size chart plots your audience membership across the selected date range. Use the 3 controls above the chart to change what it displays:
- Show Forecast: A toggle that projects the audience’s expected future size. See Forecast.
- Date range: A dropdown that sets the time window shown on the chart. Options include
Today,7 days,15 days,4 weeks,8 weeks,12 weeks, or a custom date range. - Trend / Flux: A toggle that switches the chart between the Trend and Flux views described below.
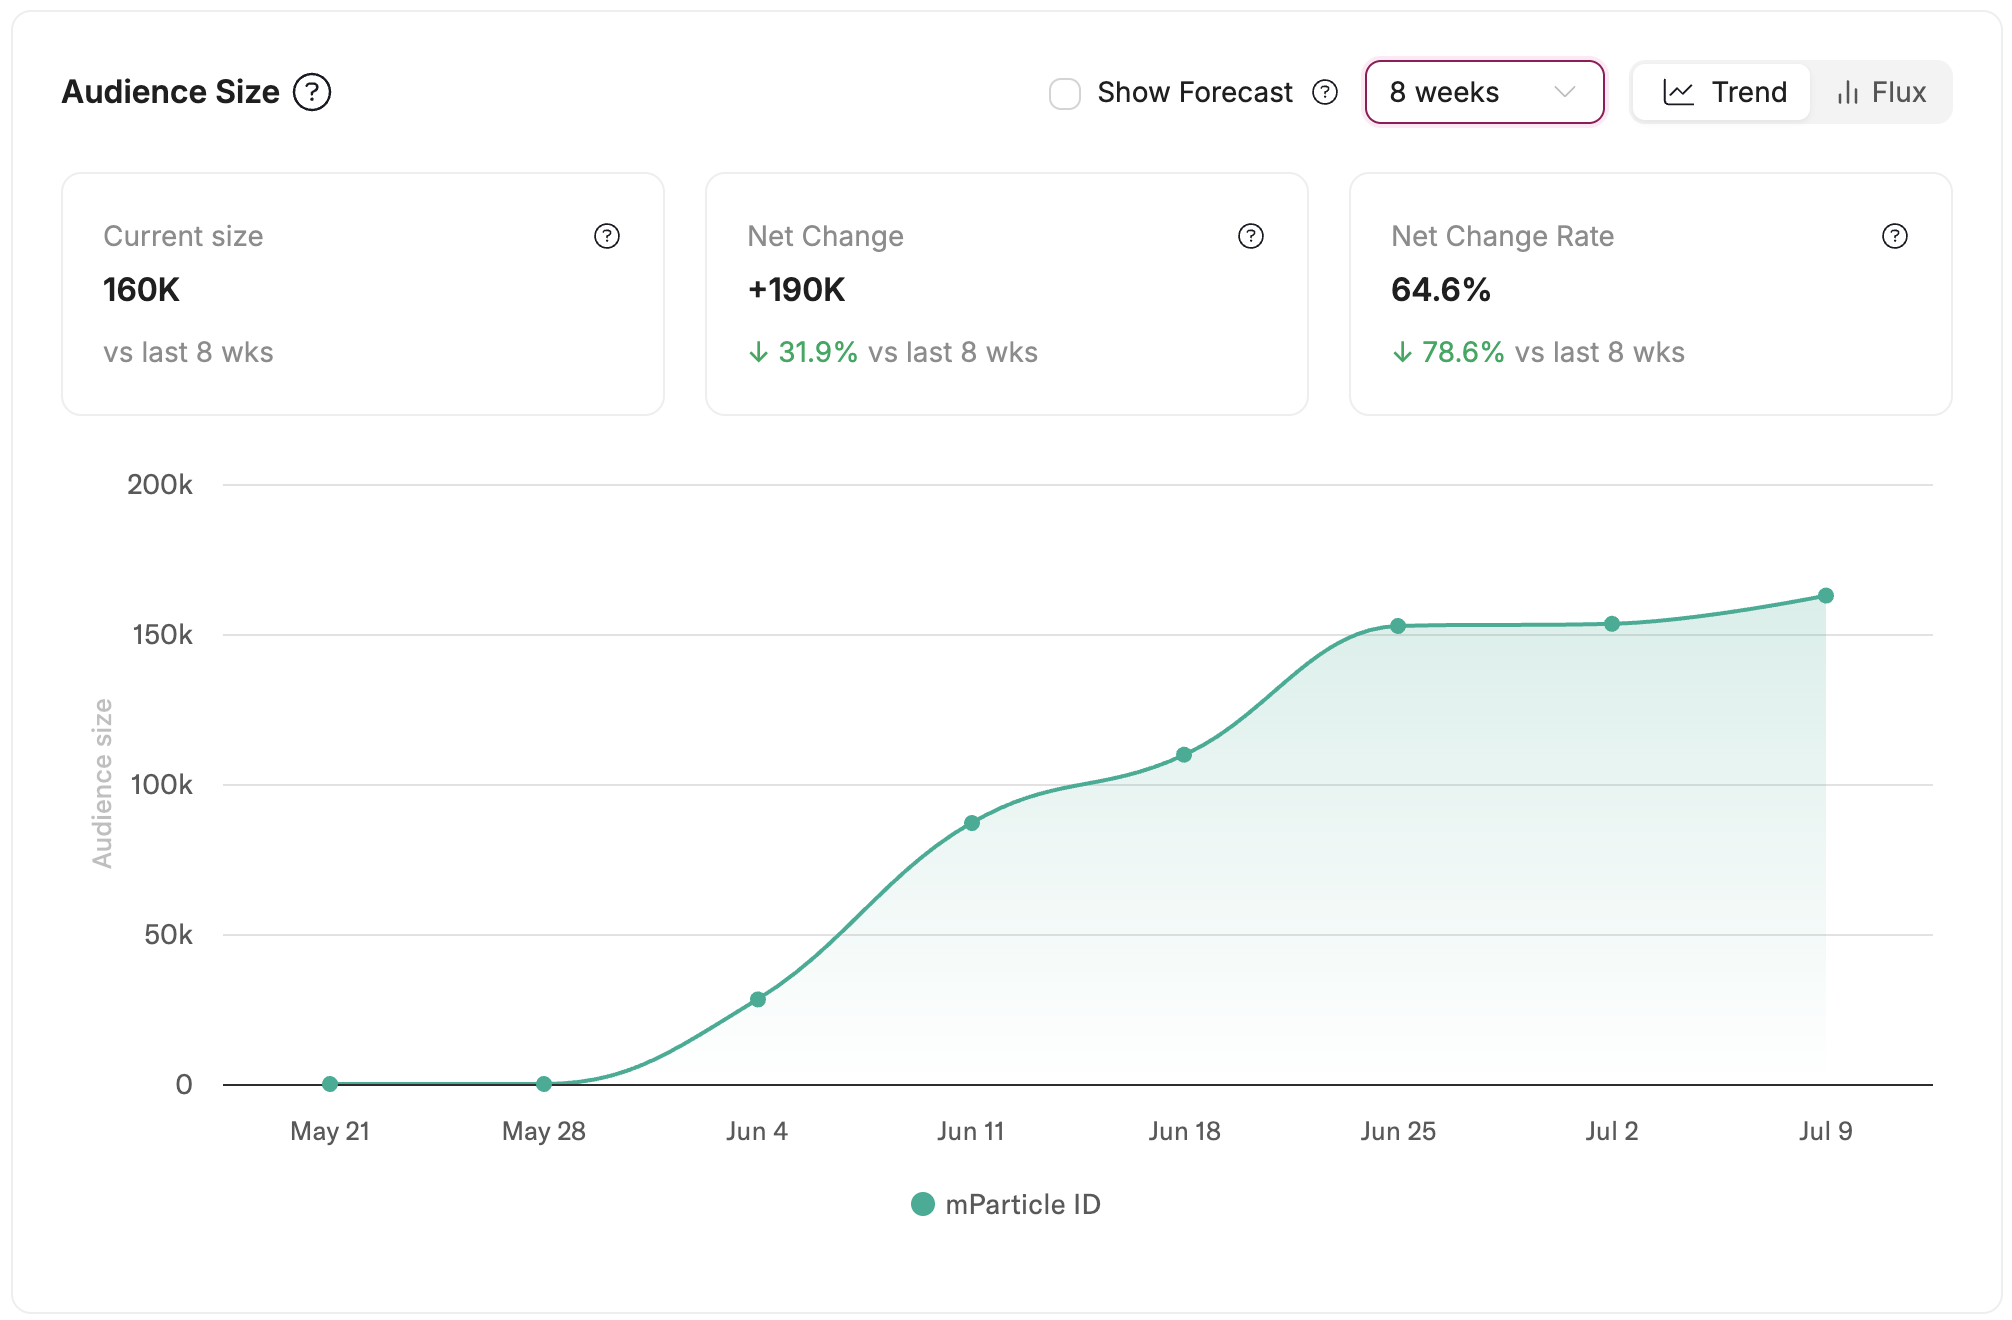
The 3 cards above the chart summarize the audience at a glance. Each card shows a headline value plus the change compared to the previous period of the same length (for example, vs last 15 days), with an up or down arrow indicating the direction of change. Each card includes a help icon with an inline definition.

- Current size: The number of users who currently qualify for the audience, based on the most recent analysis.
- Net Change: The number of users added to or removed from the audience during the selected period.
- Net Change Rate: The relative number of users added to or removed from the audience during the selected period, expressed as a percentage of the total audience size. A lower Net Change Rate generally indicates a more stable audience.
Trend view
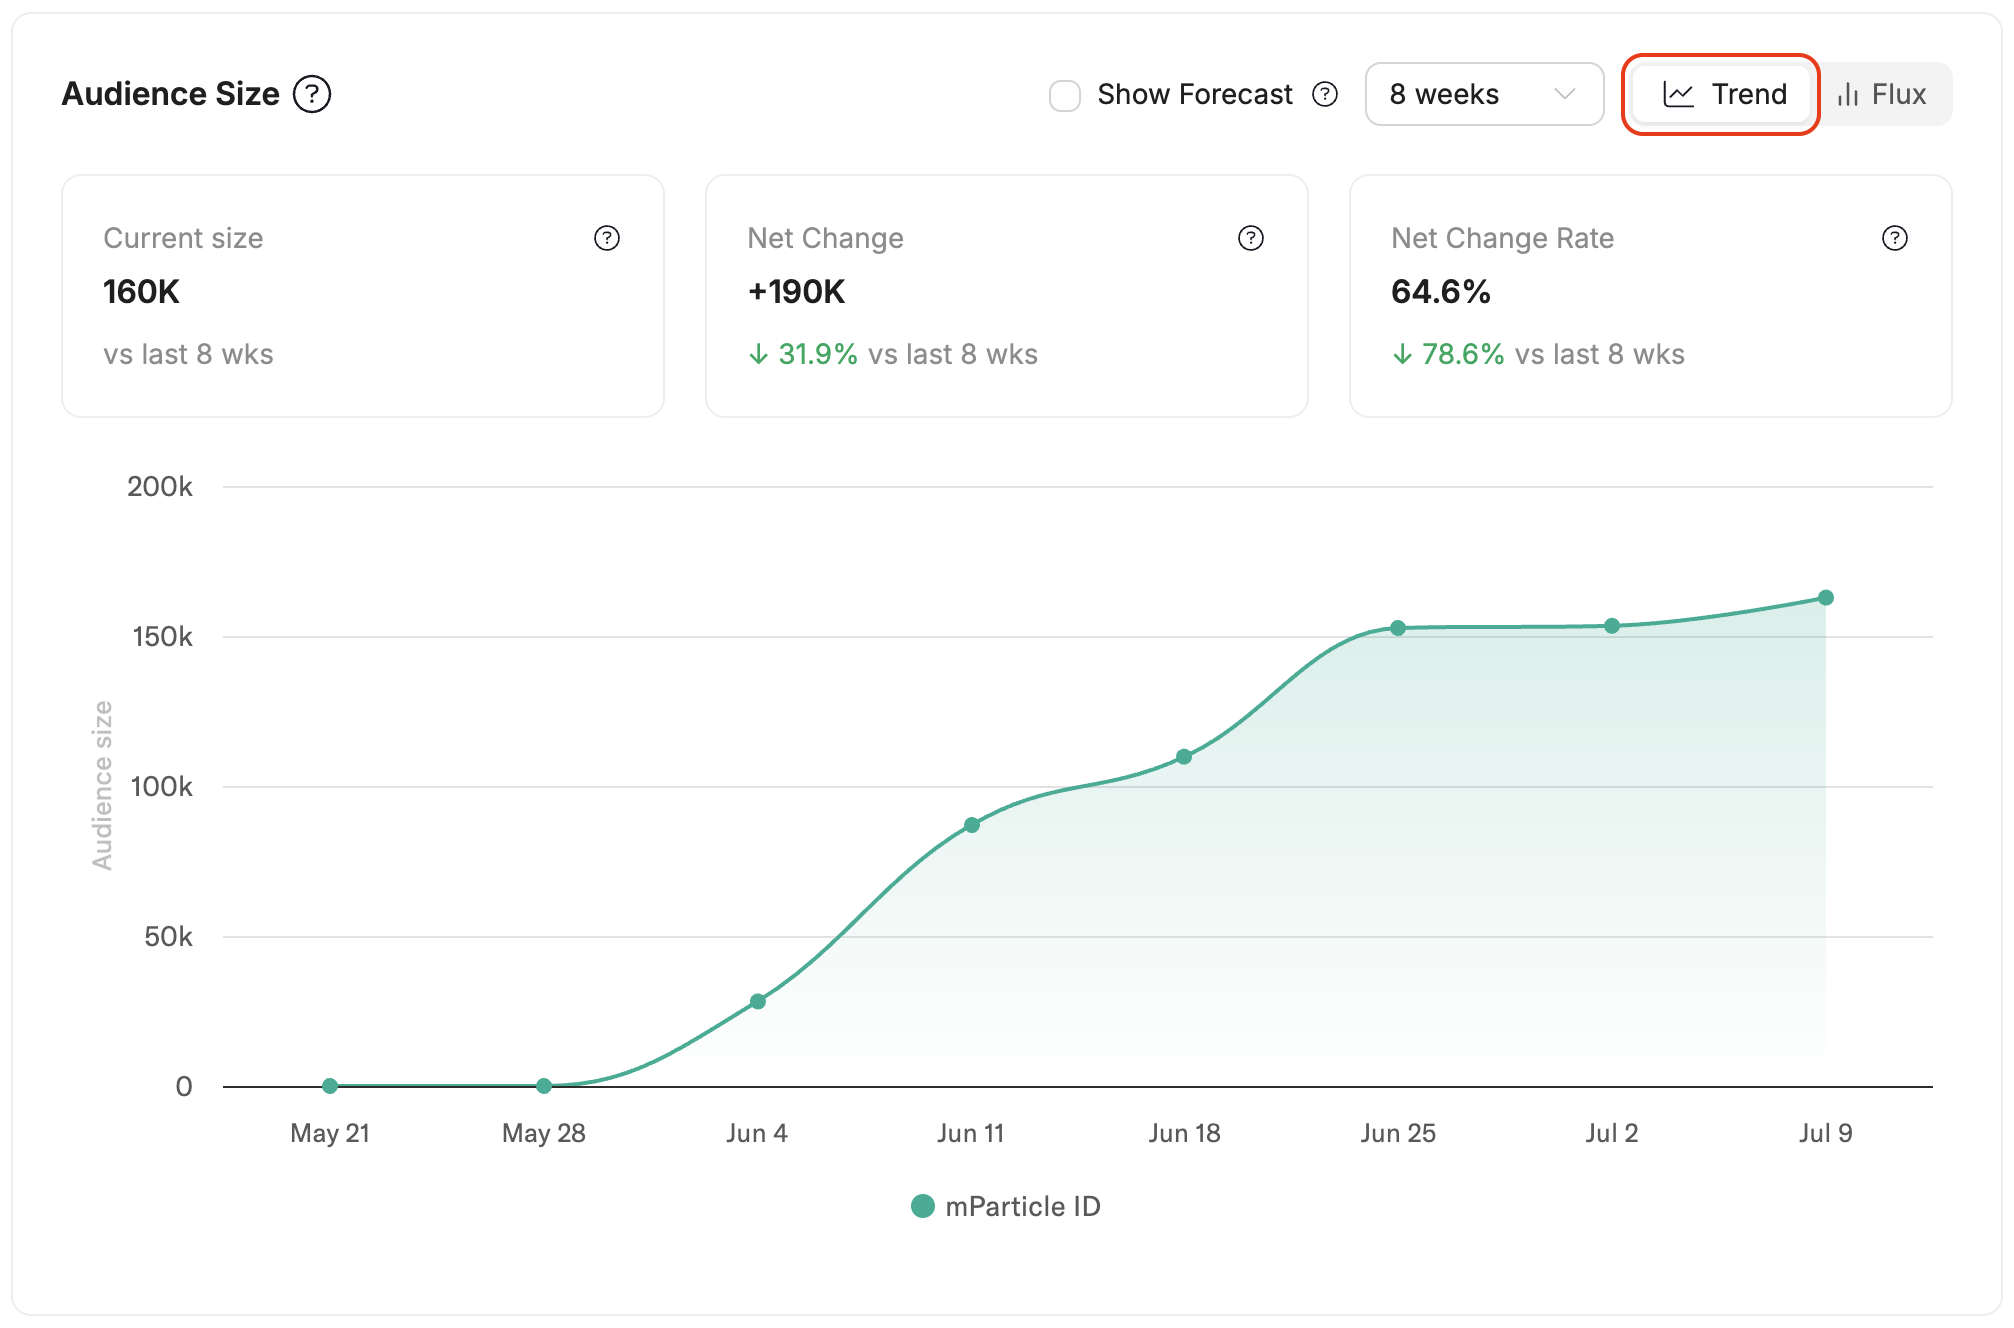
The Trend view is the default view for the Audience Health section, and shows an area chart that plots total audience size at each point across the selected window. The vertical axis is audience size and the horizontal axis is time, with a tick for each interval in the selected date range. Use the trend view to read the audience’s overall trajectory: whether it’s growing, holding steady, or declining.
Flux view
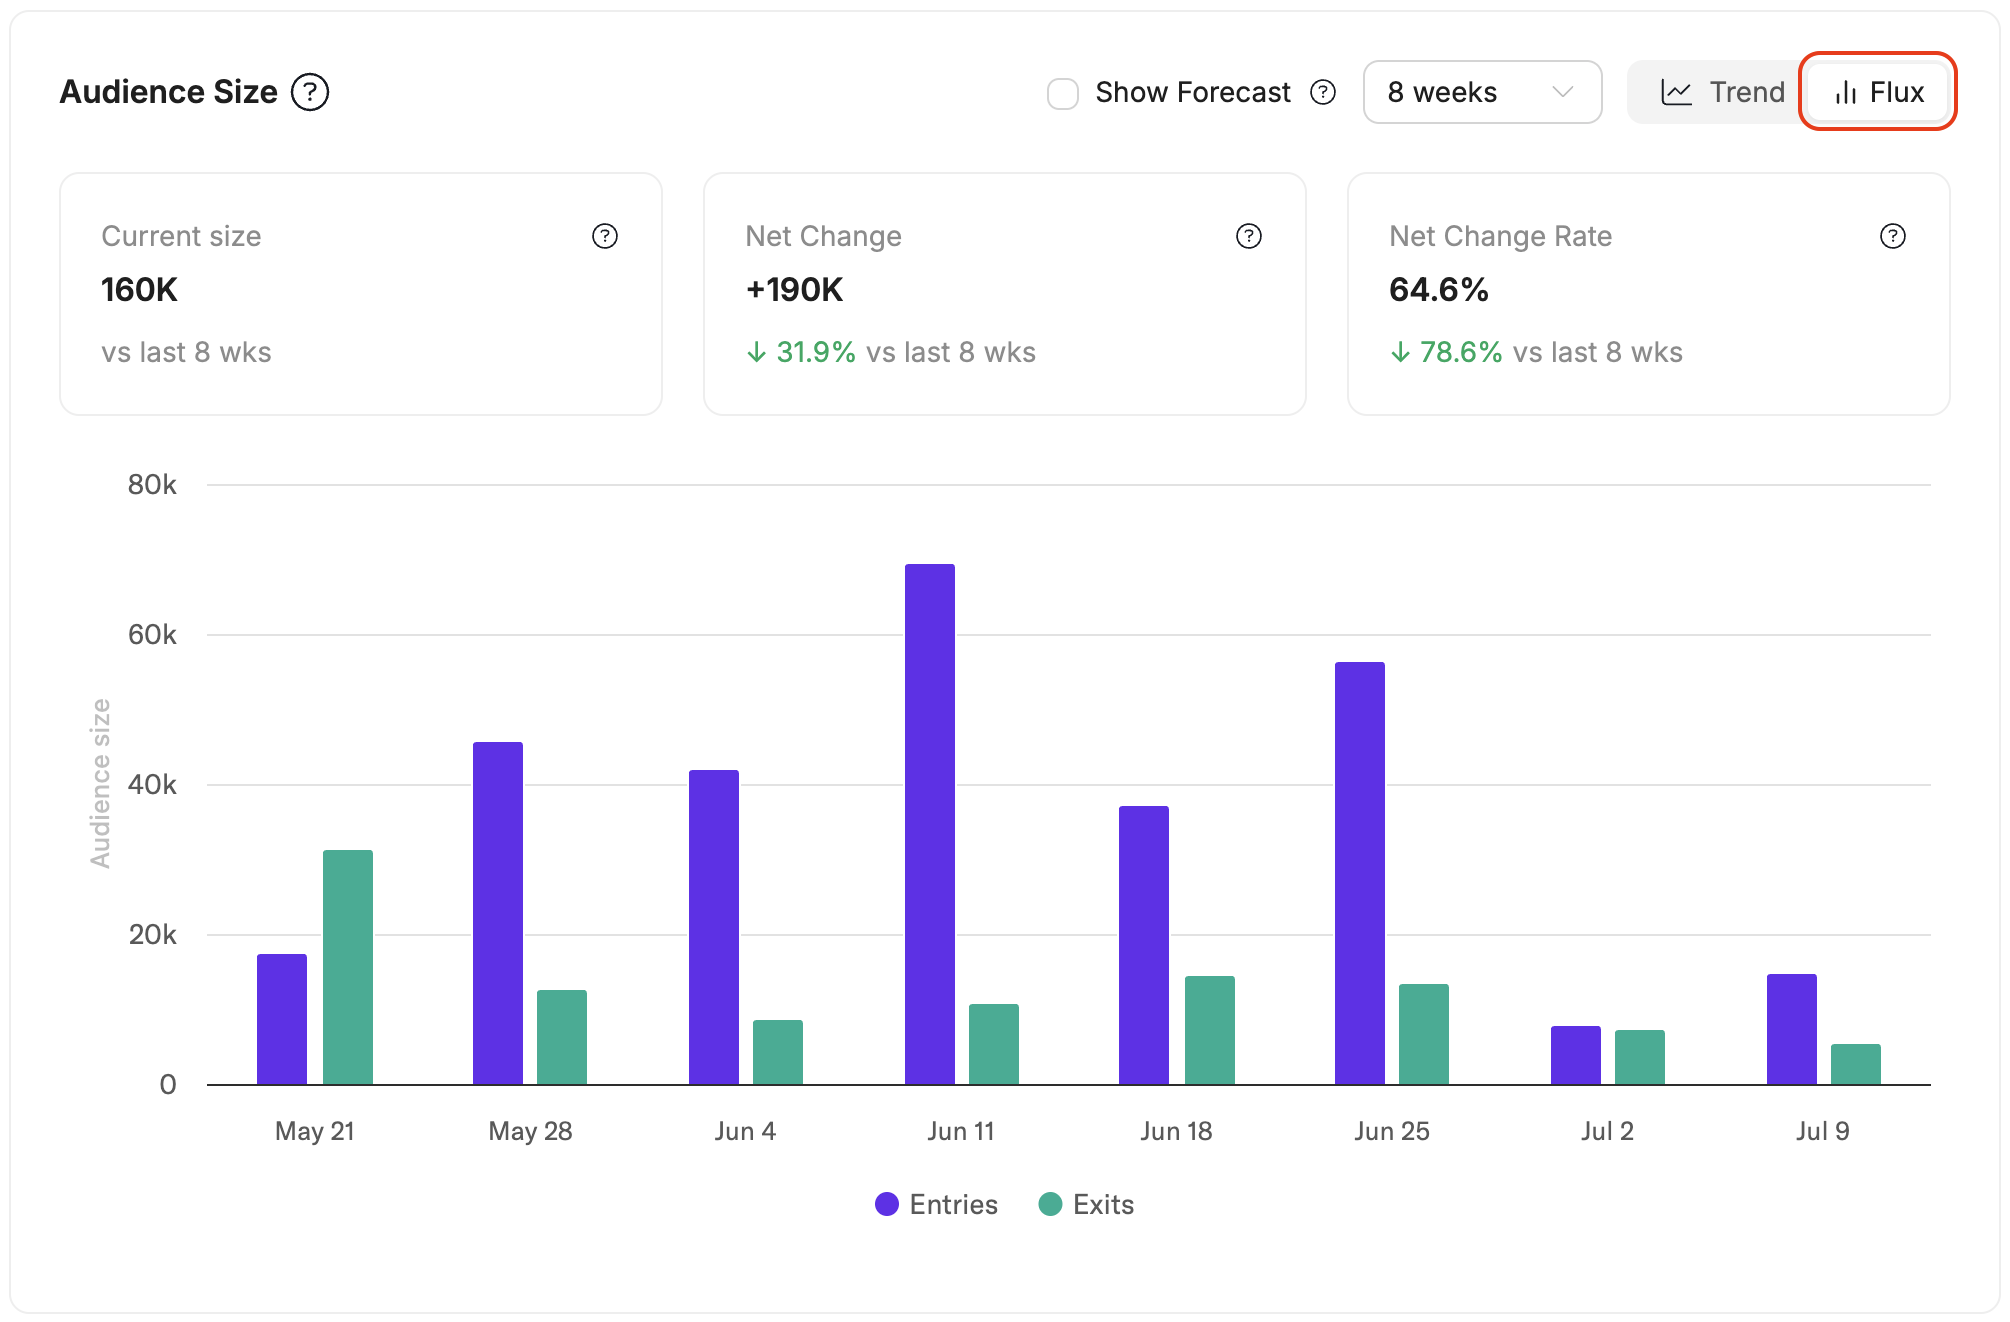
The Flux view is a grouped bar chart that shows movement in and out of the audience for each interval, rather than the running total. Each interval displays paired bars, labeled Entries and Exits, representing the users added to and removed from the audience during that period. Use the flux view to spot turnover and volatility that a stable total size can hide, such as an audience whose size looks flat but is actually cycling many users in and out each week.
Forecast
Turn on Show Forecast to project the audience’s expected size into the near future. mParticle draws the forecast as a continuation of the trend line, labeled Forecasted size, accompanied by a shaded 95% confidence range that widens the further out it projects. The historical portion of the line is labeled Actual.
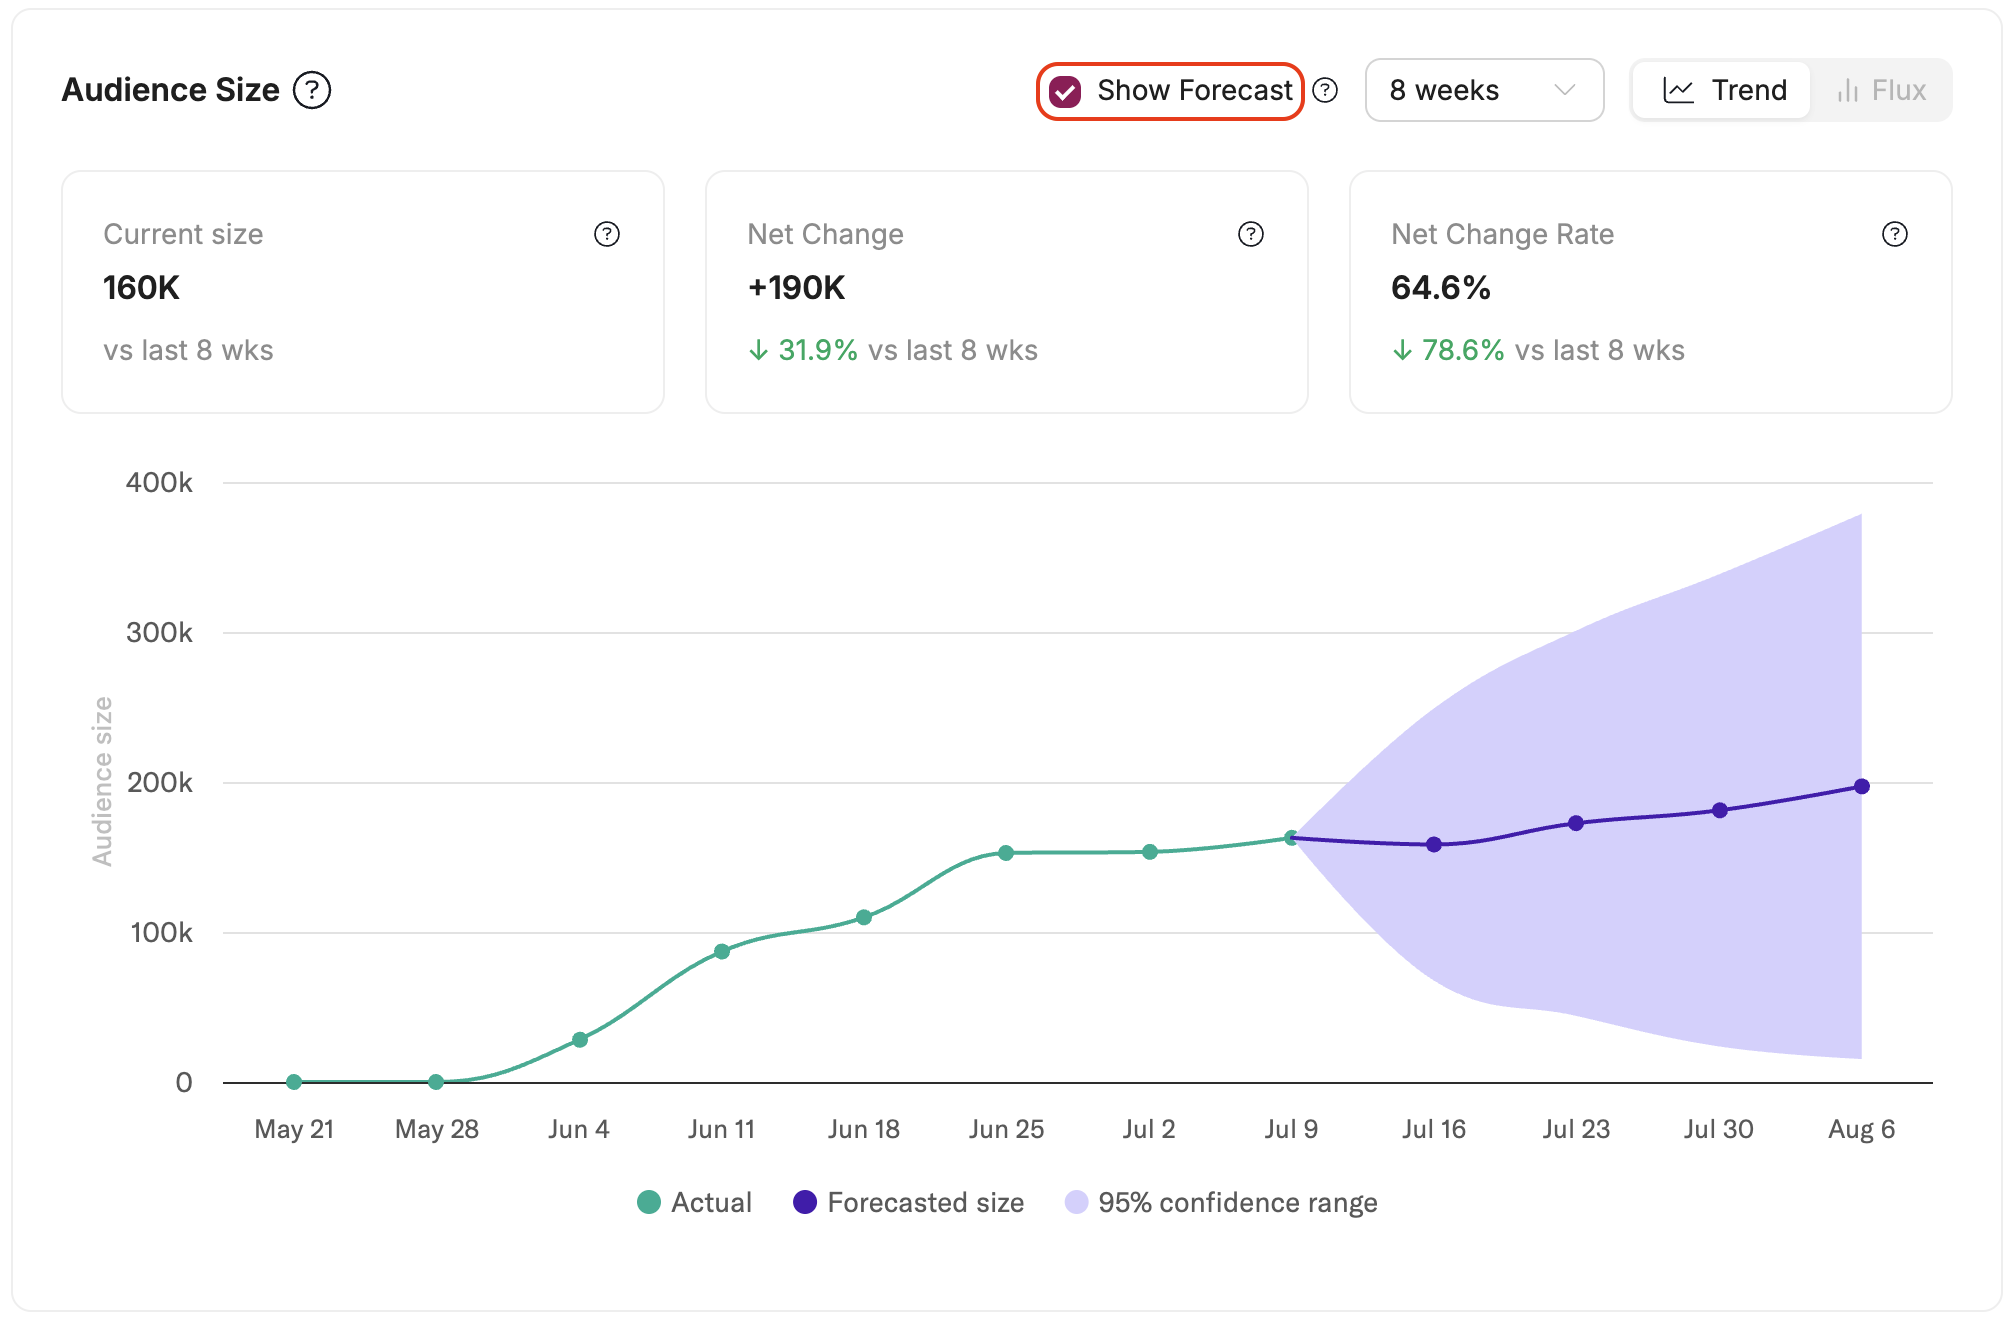
- The forecast view requires a date range of at least 4 weeks. Select the 4 weeks, 8 weeks, or 12 weeks date range to enable it. The forecast view projects 4 weeks into the future.
- The flux view is disabled while the forecast view is on. The forecast applies only to the trend view’s total size line. Turn Show Forecast off to return to the flux view.
Overlaps
The Overlaps section shows how much the current audience overlaps with other audiences you’ve already created. Use it to avoid targeting the same users across multiple campaigns, identify redundant audiences, and find closely related segments.
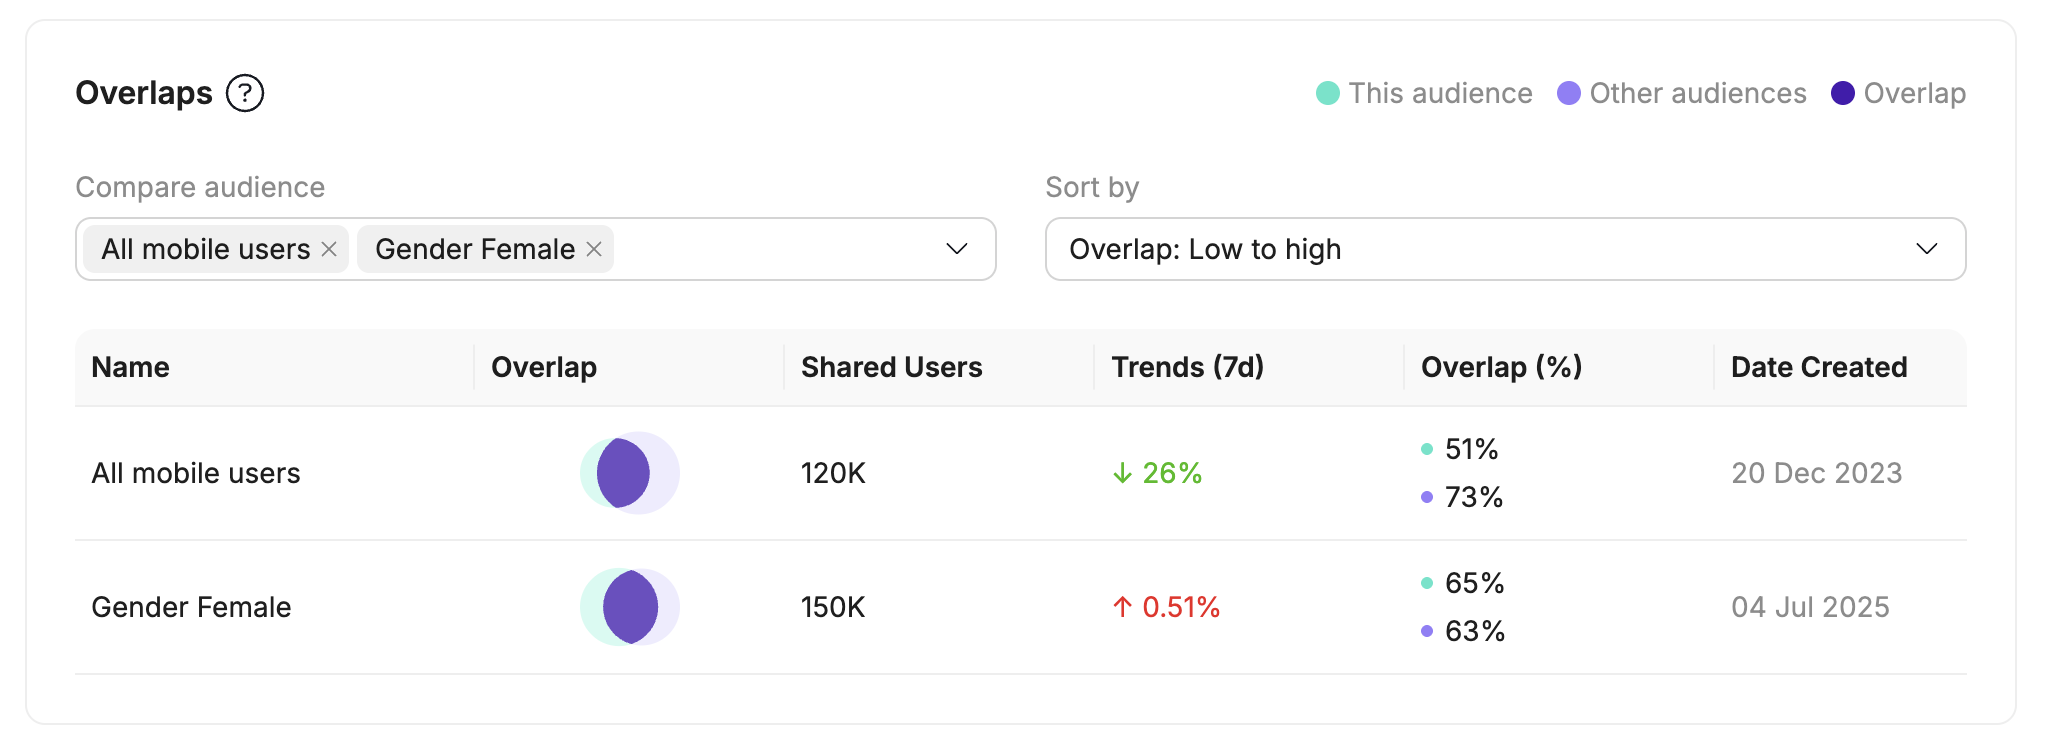
A legend at the top of the section distinguishes the parts of each comparison: This audience, Other audiences, and the Overlap between them.
Use the 2 controls above the table to choose and order the comparisons:
- Compare audience: Select which audiences to compare against the current audience. Selected audiences appear as removable chips. By default, the 8 audiences with the highest overlap are shown. If fewer than 8 other audiences exist, all of them are shown.
- Sort by: Set the order of the table, for example Overlap: High to low.
Each row in the table compares the current audience against another audience:
| Column | Description |
|---|---|
| Name | The name of the other audience being compared. |
| Overlap | A visual indicator of how much the audiences intersect. |
| Shared Users | The number of users who belong to both audiences. |
| Trends | The change in the overlap, with an up or down arrow. |
| Overlap (%) | The overlap expressed as a percentage in both directions: the share of this audience that’s also in the other audience, and the share of the other audience that’s also in this one. The 2 values use the legend colors. |
| Date Created | When the other audience was created. |
Audience Performance
Reach
The Reach section helps you assess the potential reach of your campaign across different user identifiers.
- Track identified users per identifier, such as mParticle ID, Customer ID, or Email Address
- View coverage percentages for each identifier
- Compare reach across multiple identification methods
Each identifier count reflects unique identifiers, not unique users. A user with both an email address and a mobile phone number contributes to the count for each identifier type.
Use the tabs above the chart to choose what to compare:
- Overview: Compare total identifier counts across identifier types.
- Enrichment Breakdown: See how much reach comes from first-party data and how much comes from enrichment for each identifier type. This tab appears when Match Boost or Household Reach is enabled for the audience.
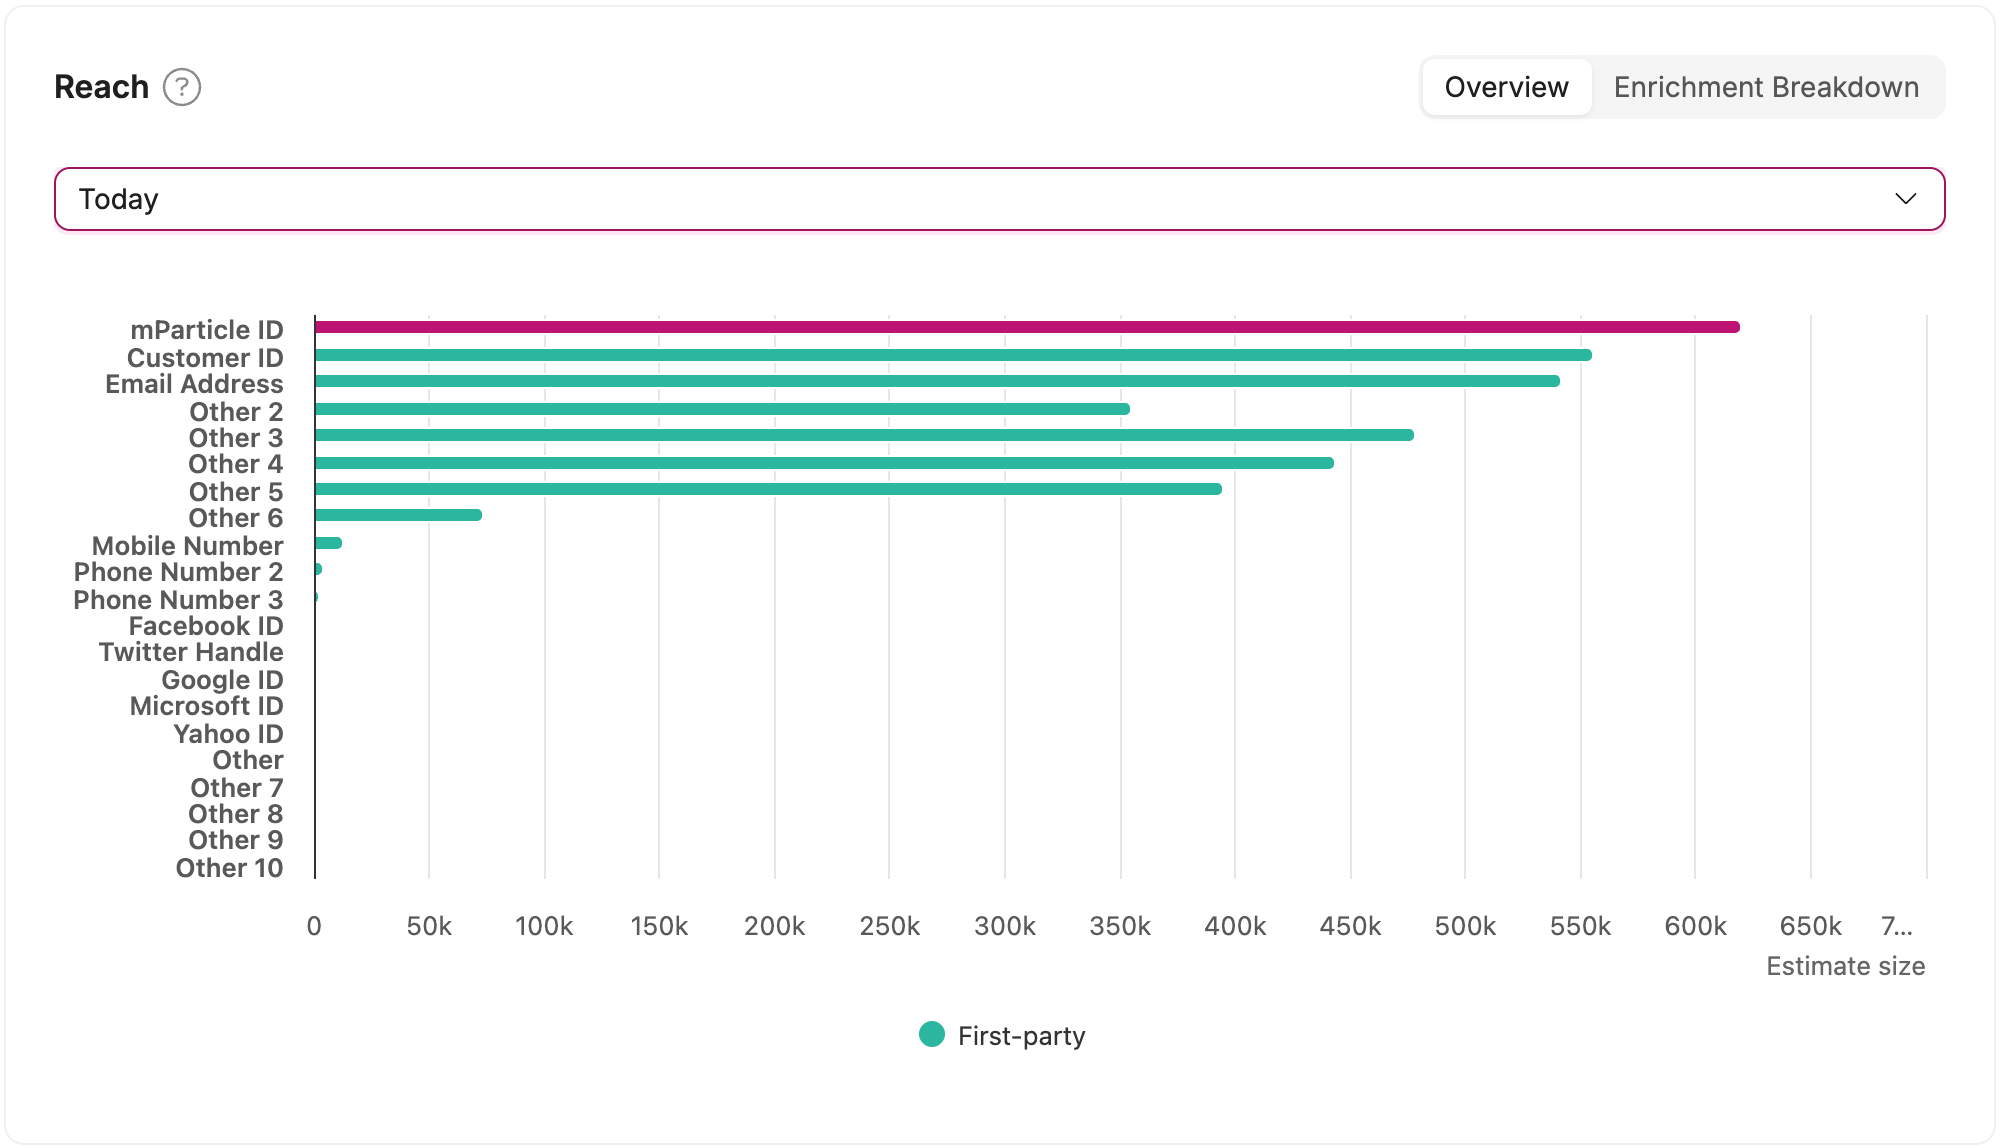
Select Today to review current reach. In Overview, a horizontal bar chart shows the current estimated count for each identifier type. Bar length represents the number of unique identifiers along the Estimate size axis.
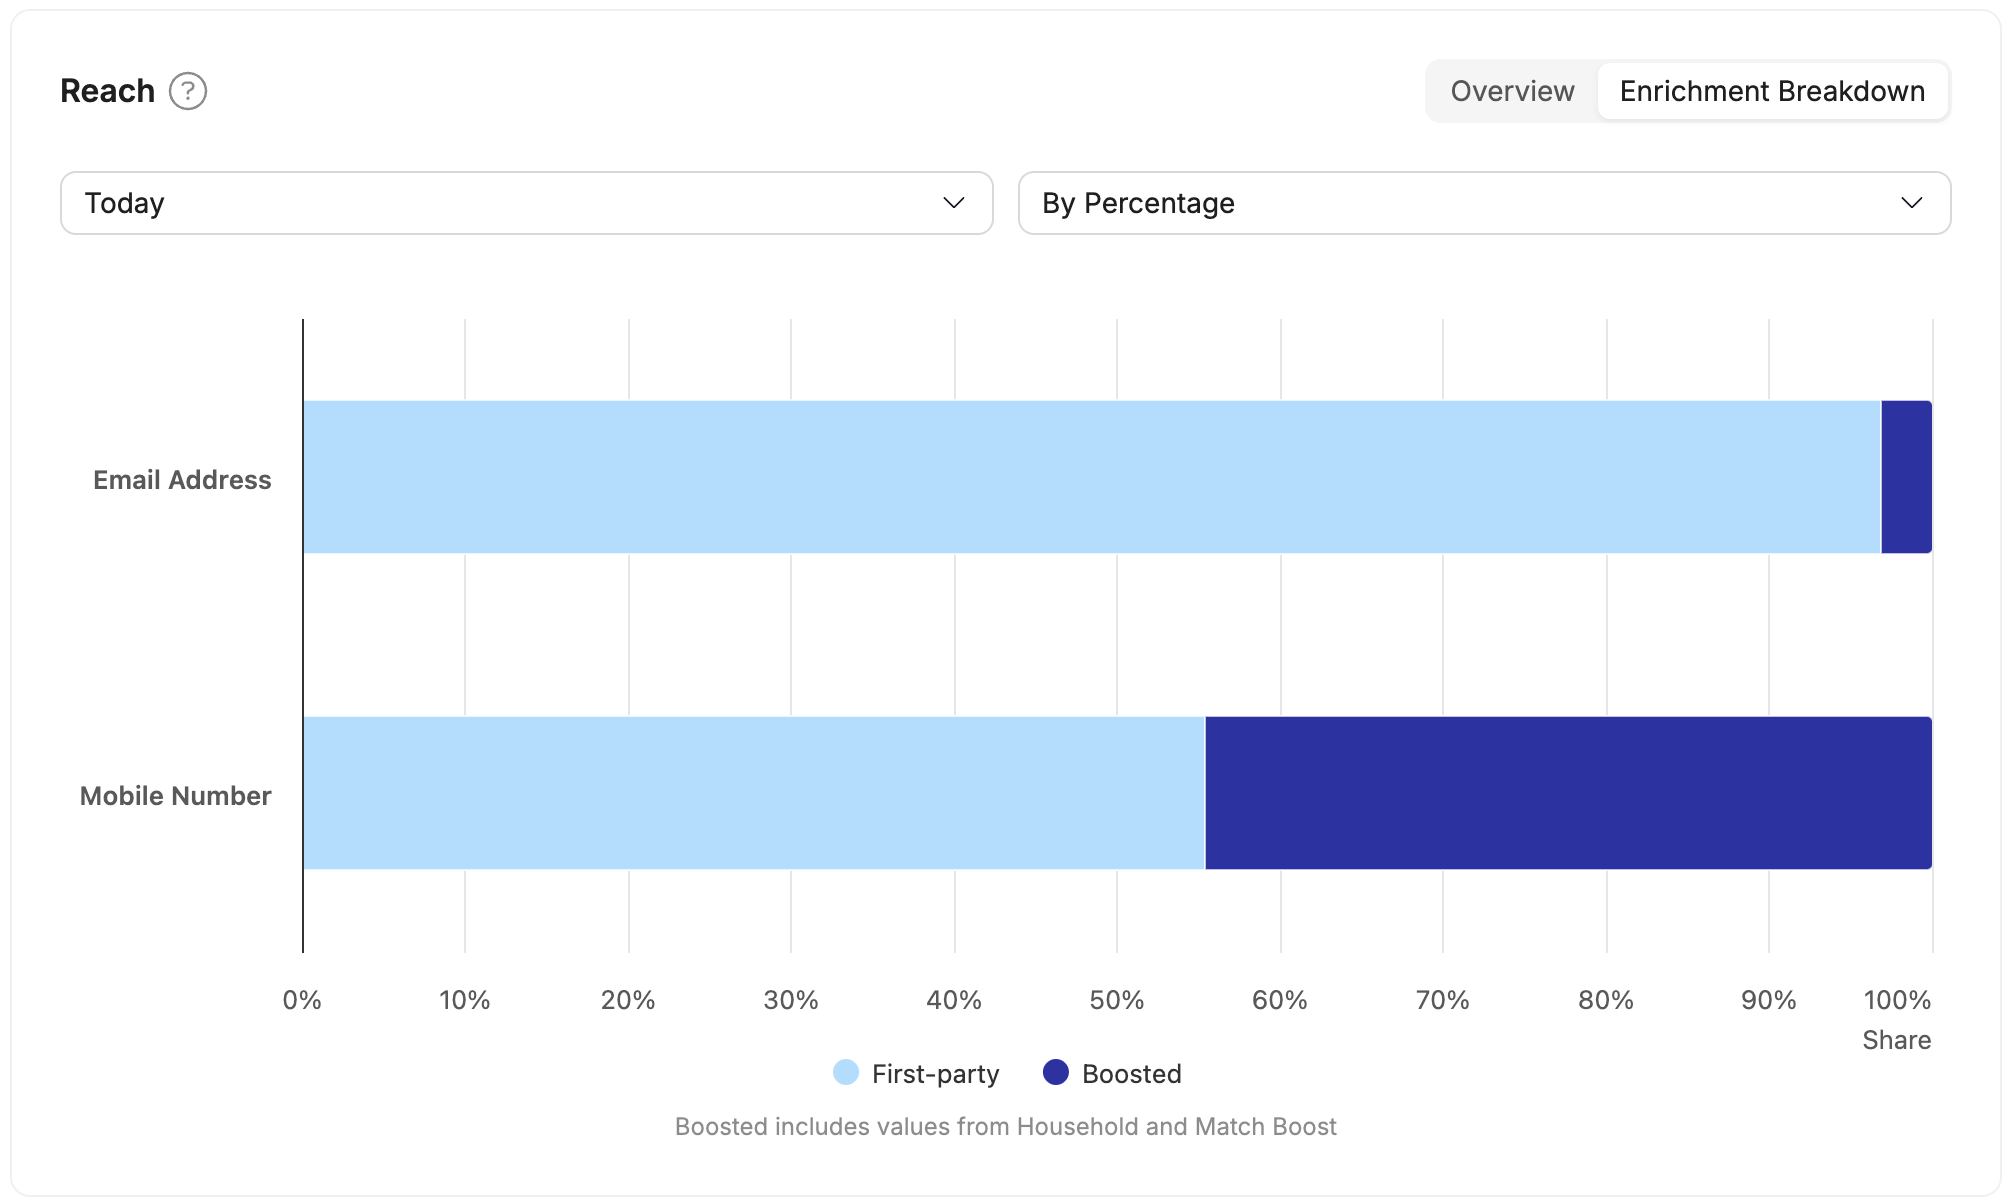
In Enrichment Breakdown, select Today to see current reach for identifier types that Match Boost or Household Reach can enrich. Each horizontal bar represents one identifier type and has 2 segments:
- First-party: Identifiers sourced from your own mParticle data.
- Boosted: Identifiers added through Match Boost or Household Reach. When both features are enabled, this segment combines their contributions.
Select By Percentage to show each source as a percentage of the total identifier count for that identifier type, or By Count to show absolute identifier counts. Hover over a segment to see its count and percentage.
For example, if an email bar contains 10,000 identifiers and 2,000 came from enrichment, the Boosted segment represents 20% of those email identifiers. This doesn’t mean enrichment made 20% more audience members reachable. The Email Reach and Mobile Reach cards measure the percentage of audience members with an identifier available for each channel.
mParticle ID appears in the enrichment breakdown when Household Reach is enabled. Its Boosted segment reflects household expansion only, because Match Boost doesn’t add mParticle IDs.
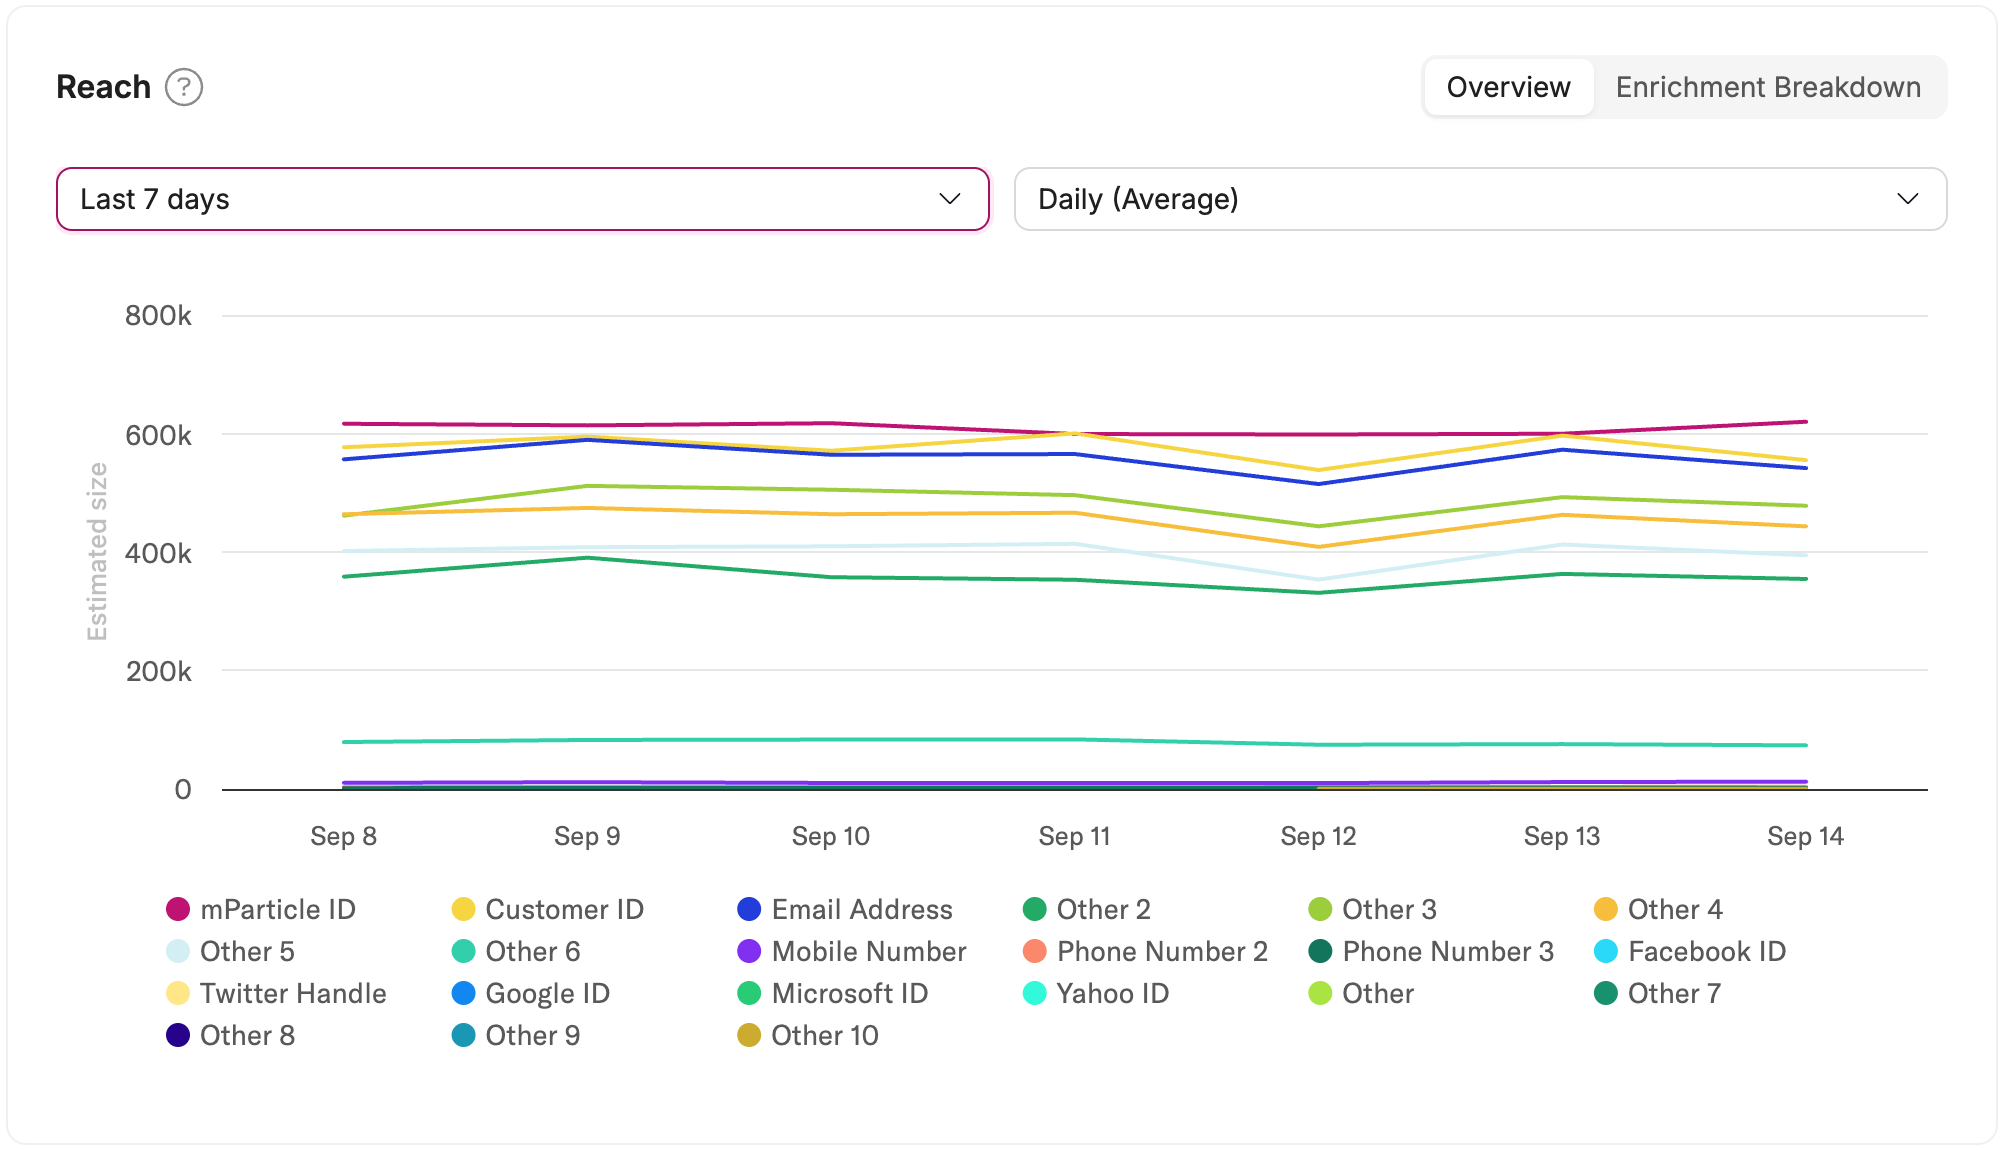
Select a time range other than Today to see which identifier counts are increasing or decreasing. Use a shorter range to examine a recent change, or a longer range to follow a trend.
In Overview, the chart switches to a line chart, with one line per identifier type. Hover over a data point to see its estimated count and date. Select Daily (Average) to view daily changes, or Weekly (Average) or Monthly (Average) to compare averages over longer intervals.
In Enrichment Breakdown, select an identifier above the chart to examine how its first-party and boosted counts change. For example, if email identifier counts decline, the chart shows whether the decline comes from first-party data, enrichment, or both.
With Daily selected, stacked bars show first-party and boosted reach for each period, with a line showing total reach. Dashed vertical lines mark when Match Boost was enabled or disabled.
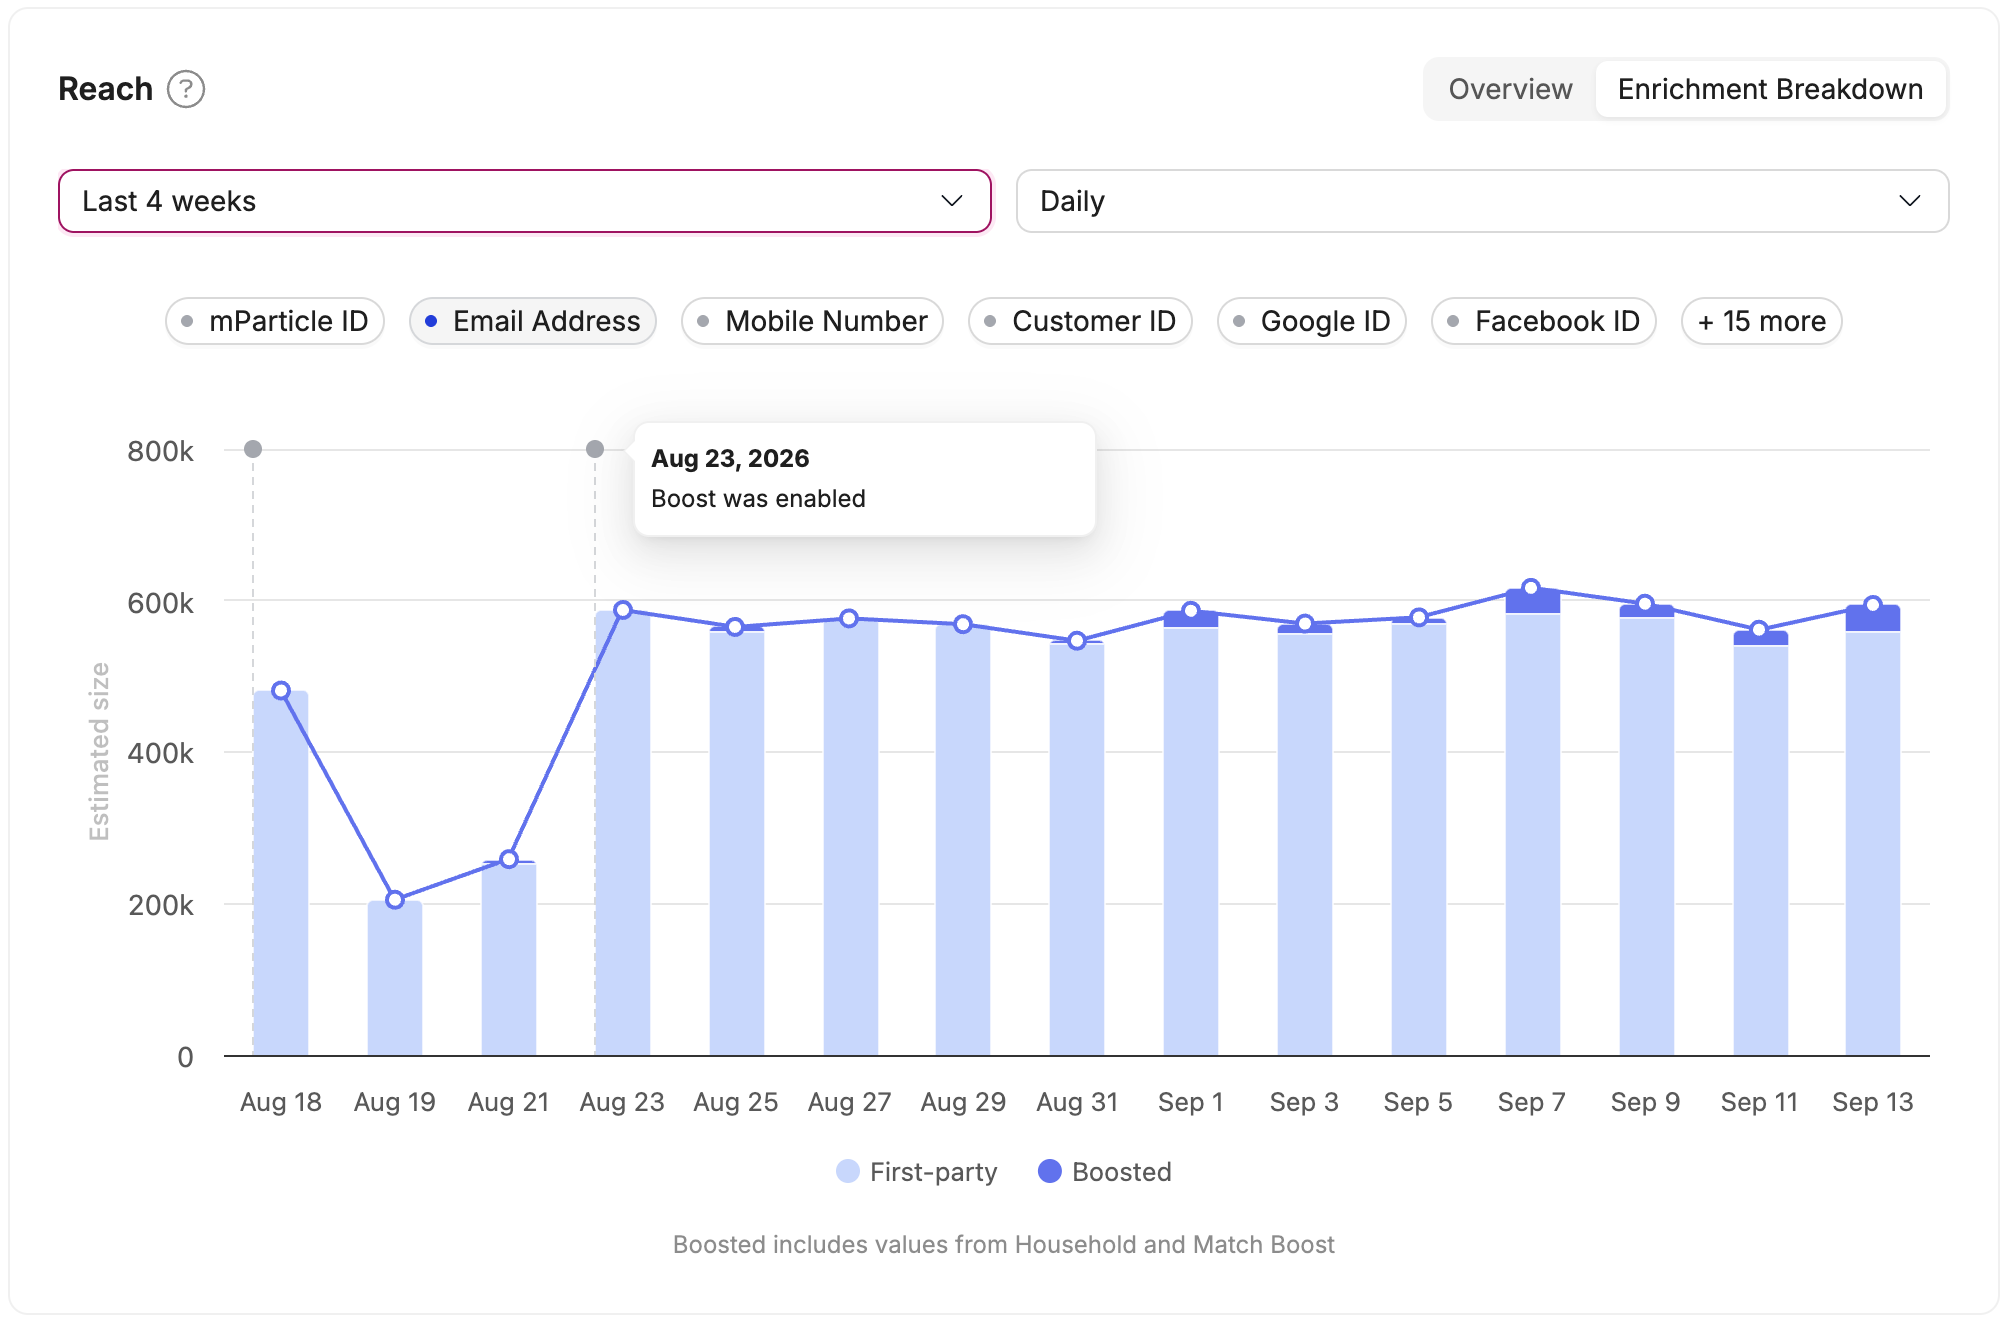
Choose Weekly (Average) to compare weekly averages in a stacked area chart, or Monthly (Average) to group data by month.
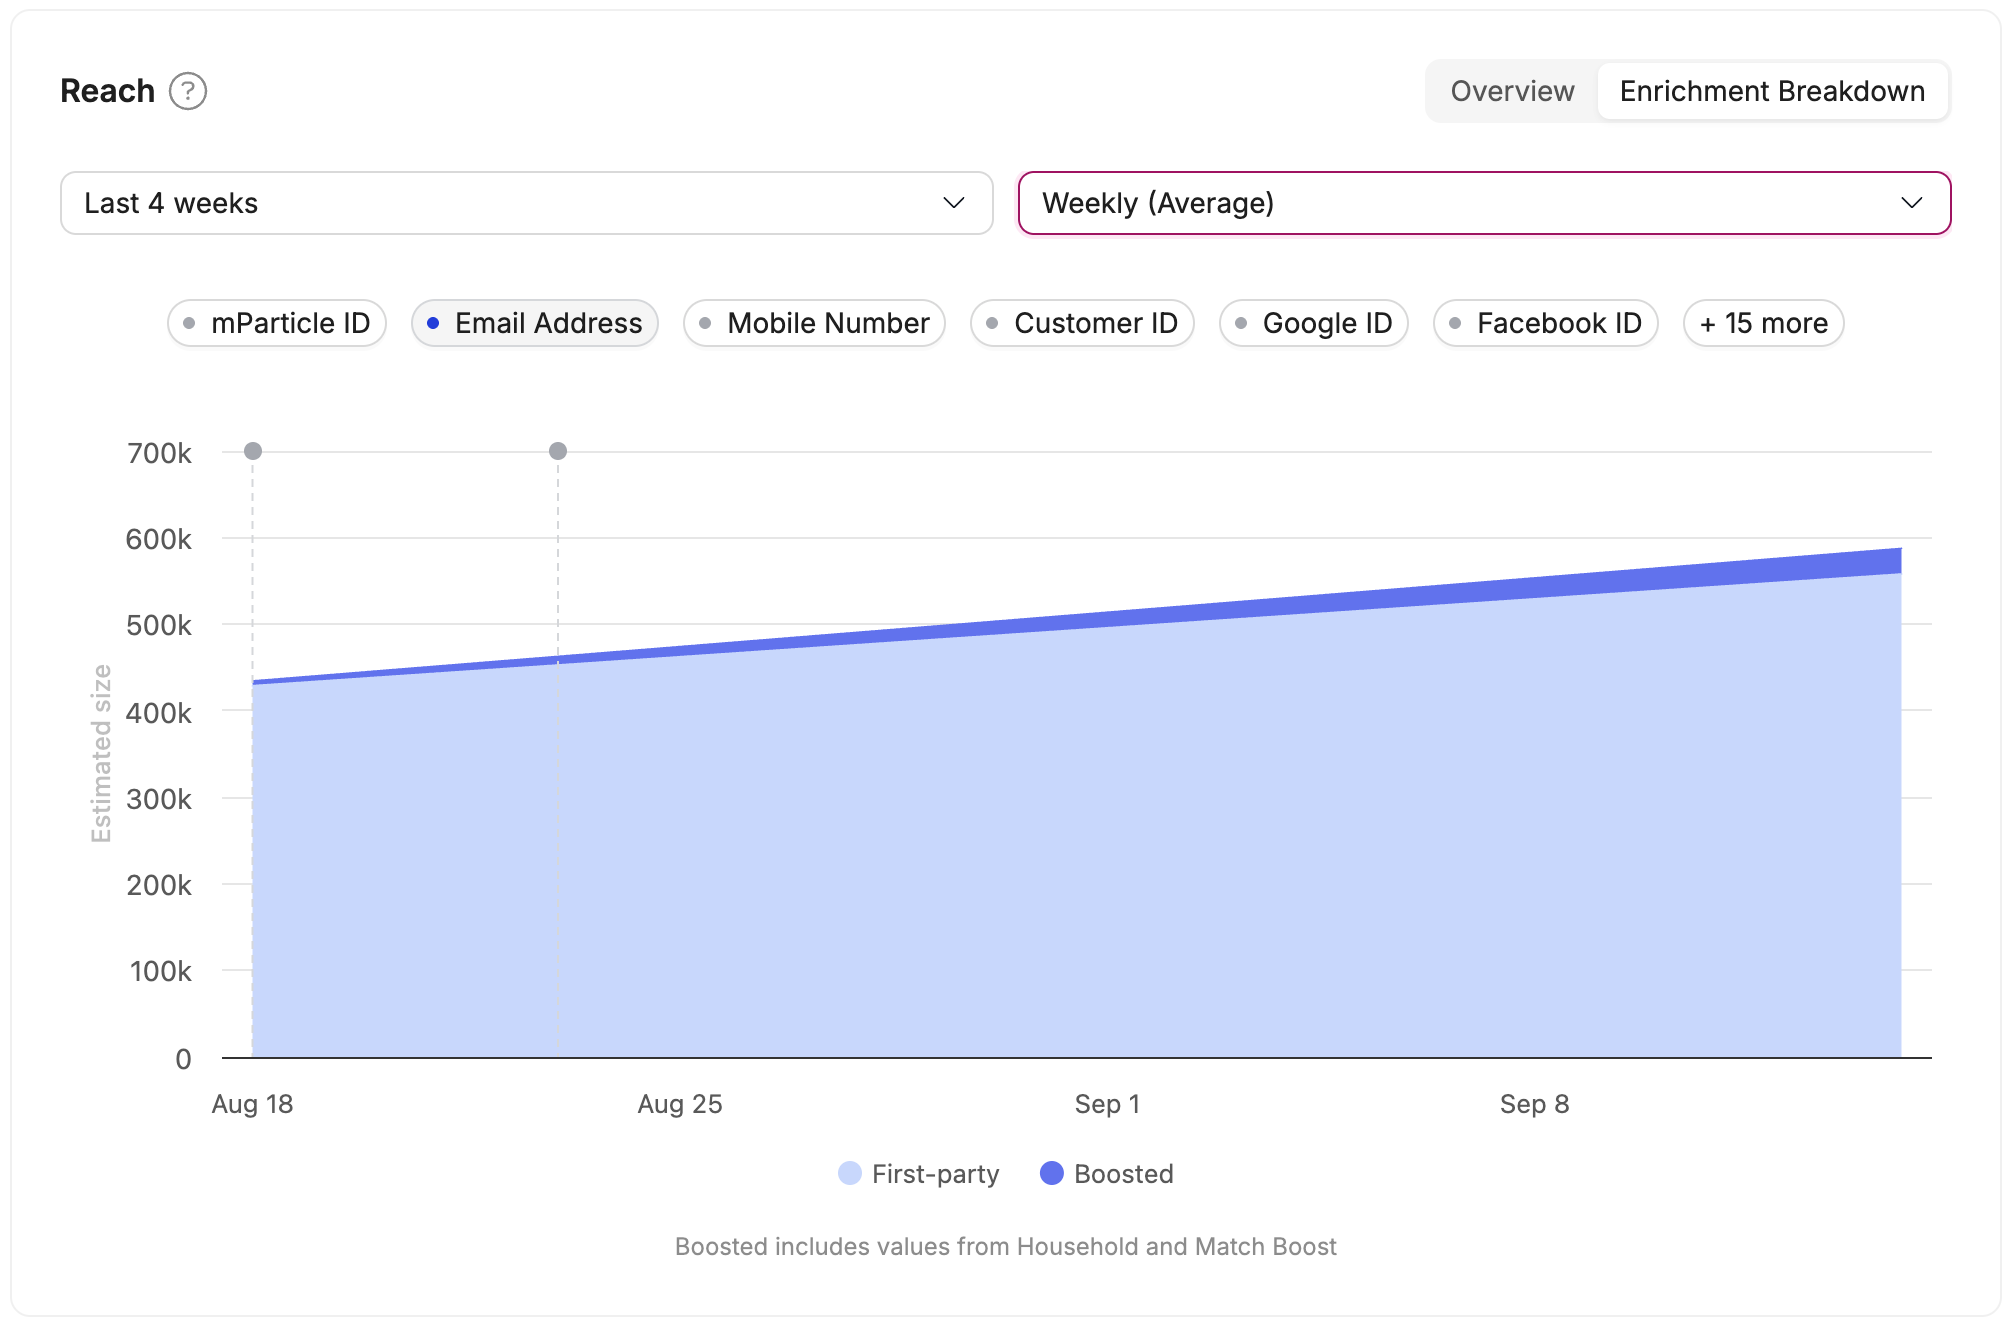
The historical Enrichment Breakdown chart displays at most 15 data points. With Last 4 weeks and Daily selected, days are grouped to fit this limit, so not every day appears individually. With Weekly (Average), the same range shows up to 4 weekly averages.
If data is unavailable for a period, this chart shows a gap or grayed-out bar. This doesn’t indicate audience loss.
You can also compare Match Boost snapshots using the By benchmarks view.
Benchmarking
The Benchmarking section shows your audience’s email and mobile phone reach and how many identifiers Match Boost added. Use it to compare reach before enrichment, when Match Boost was switched on or off, and today.
You can access Benchmarking below the Reach chart in the Insights tab in Audience Builder. It also appears when you review an audience in the Update Audience flow. The summary cards, benchmark chart view, and Identities table are available only for audiences where Match Boost has been enabled.
Reach summary
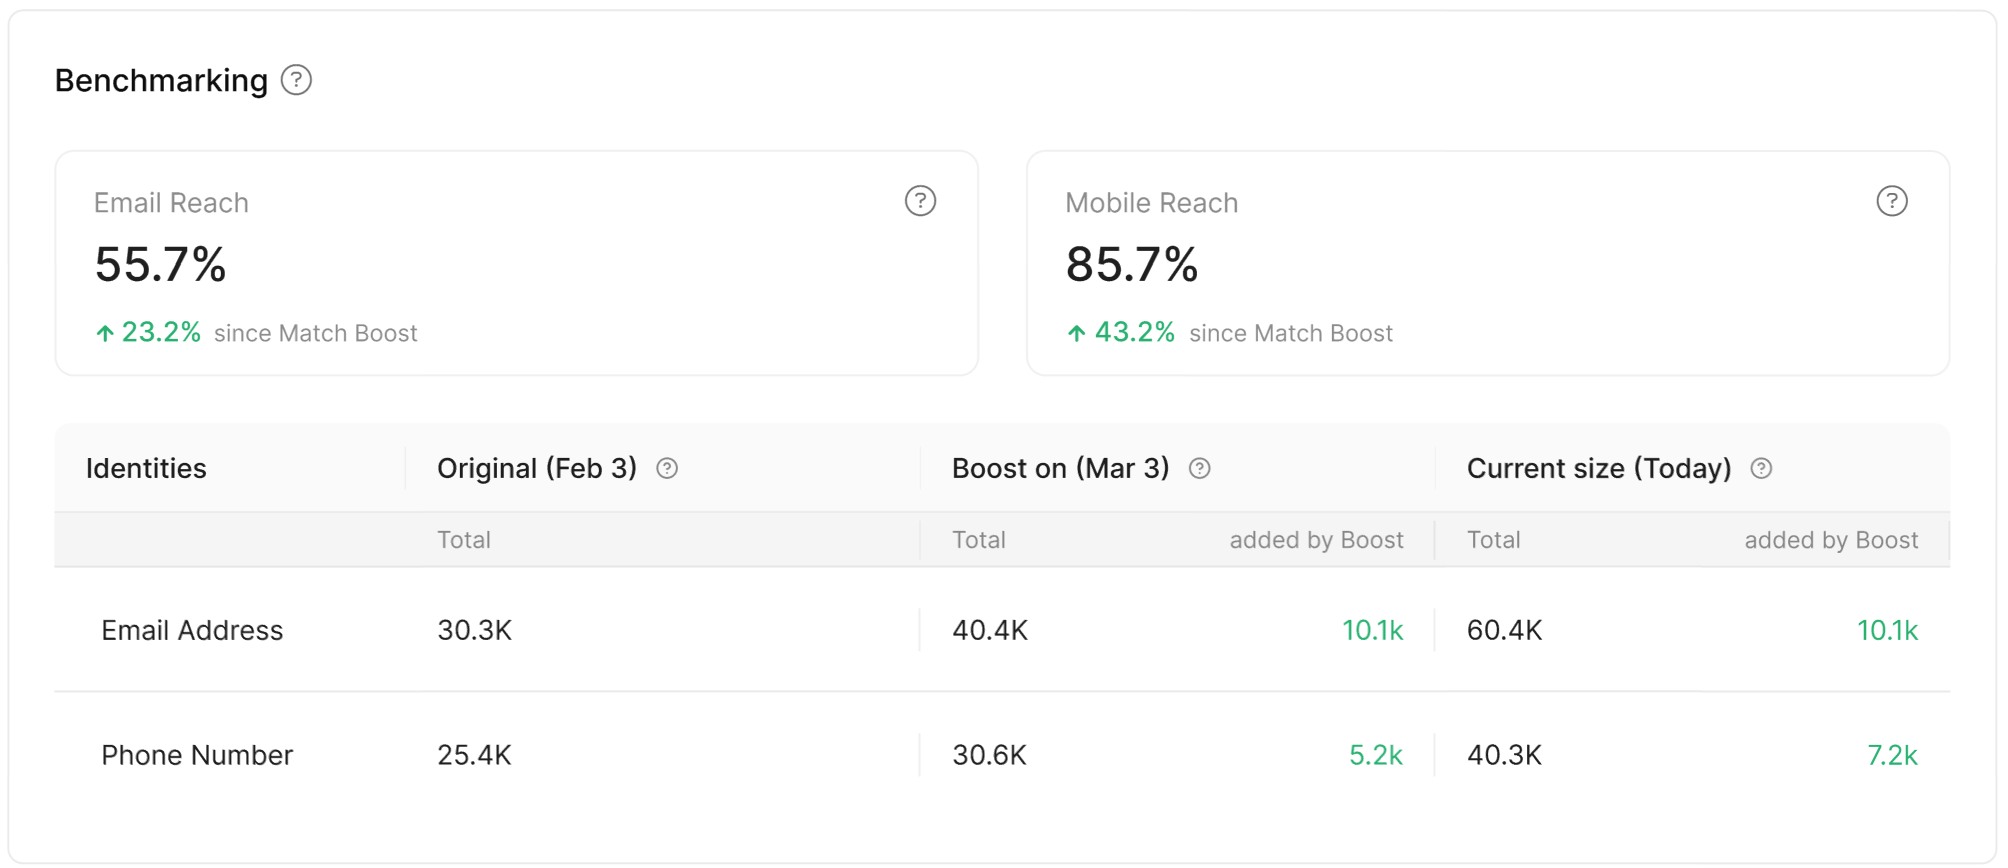
The 2 summary cards show how much of your audience you can reach through each channel:
- Email Reach: The percentage with an email identifier available for matching.
- Mobile Reach: The percentage with a mobile phone number available for matching.
Each card shows the current percentage and, when available, the change since Match Boost, with a help icon explaining the metric. These percentages describe identifier availability, not confirmed matches in downstream platforms.
Identities table
The Identities table compares estimated counts for each identifier type before enrichment, when Match Boost was enabled or disabled, and today. Benchmarking includes only identifier types that Match Boost can enrich, such as email addresses and phone numbers.
| Column | Description |
|---|---|
| Original (date) | The identifier count at the audience’s first snapshot, before Match Boost ran. |
| Boost on (date) | The total identifier count when Match Boost was enabled, plus how much of that total was added by Match Boost. |
| Boost off (date) | The total identifier count when Match Boost was disabled, after identifiers added by Match Boost were removed. This column appears only when Match Boost has been disabled. |
| Current size (Today) | The latest total identifier count, plus how much of that total was added by Match Boost. |
Audience membership and first-party identifier counts can change between snapshots. To identify Match Boost’s contribution, use the added by Boost count rather than the difference between total counts. For example, if Original contains 6,000 email identifiers and Current size (Today) contains 10,000, including 2,000 added by Match Boost, the count attributed to Match Boost is 2,000 even though the total grew by 4,000.
The count added by Match Boost can continue to grow between the Boost on and Current size (Today) snapshots as Match Boost finds new matches.
View reach by benchmark
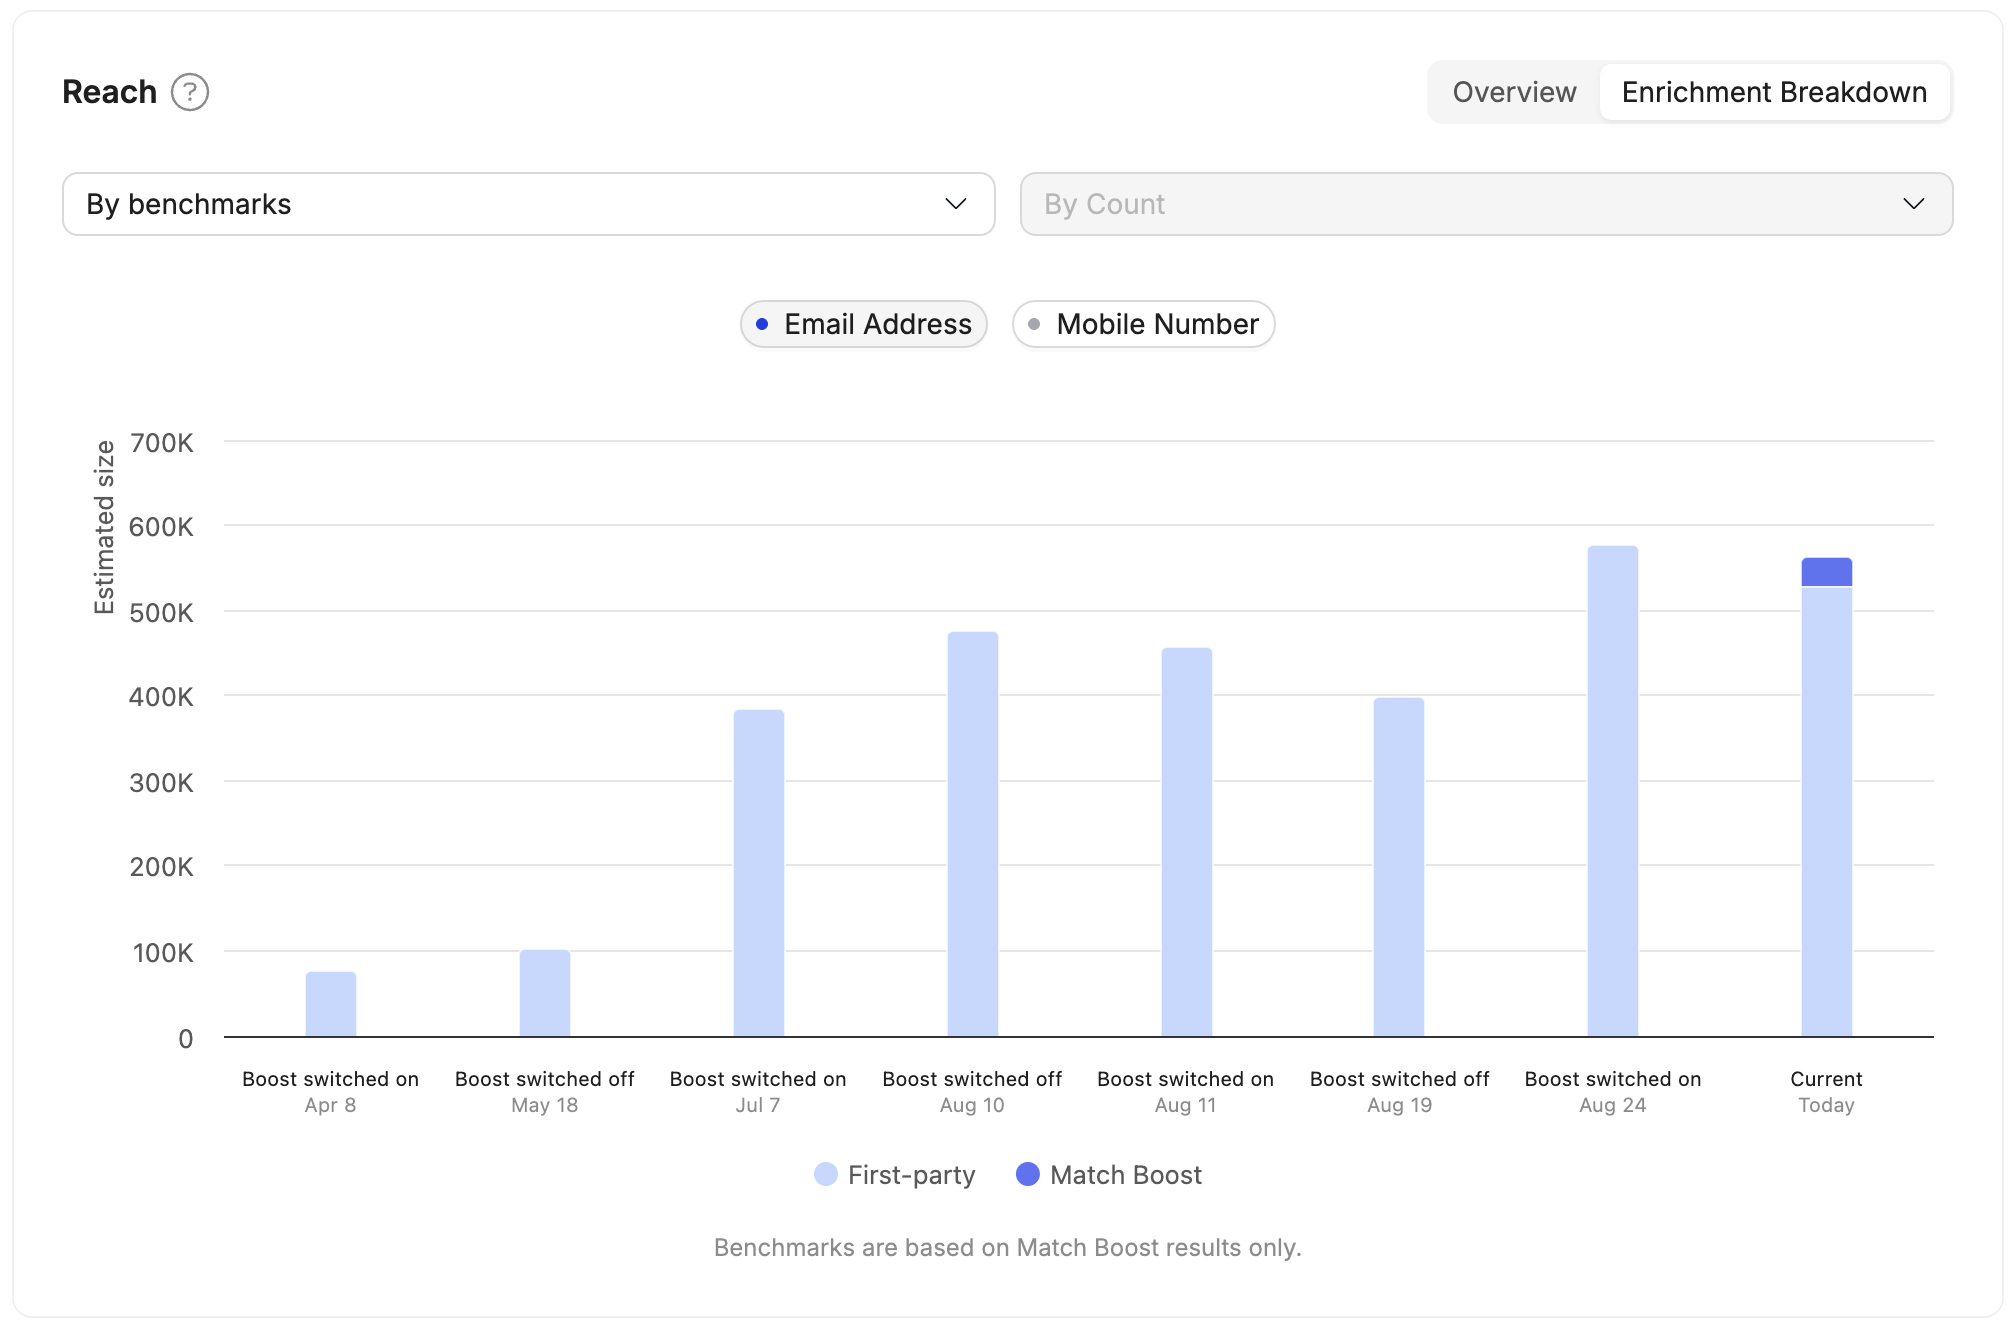
In the Reach chart’s Enrichment Breakdown tab, select By benchmarks. Use the identifier selector to switch between the identifier types available for your audience.
Each stacked bar separates First-party identifiers from identifiers added by Match Boost at a benchmark: Original, Boost switched on, Boost switched off when applicable, and Current. The chart and Identities table use the same snapshots. The chart shows 1 identifier at a time, while the table shows all supported identifiers together.
Changes to benchmark history
Updating an audience’s definition clears its previous benchmarking history. The next snapshot becomes the new comparison baseline and is labeled Updated definition instead of Original.
If you enable and disable Match Boost multiple times, the benchmark chart and Identities table show a snapshot for each change. Periods when Match Boost was off show no Match Boost contribution. Match Boost data resumes after it’s enabled again.
Composition
The Composition section shows the distribution of different values of an attribute across your audience to understand your audience demographics and characteristics. Hover your cursor over each section of the pie chart to:
- See percentage breakdowns for each attribute
- Compare relative sizes of different user segments
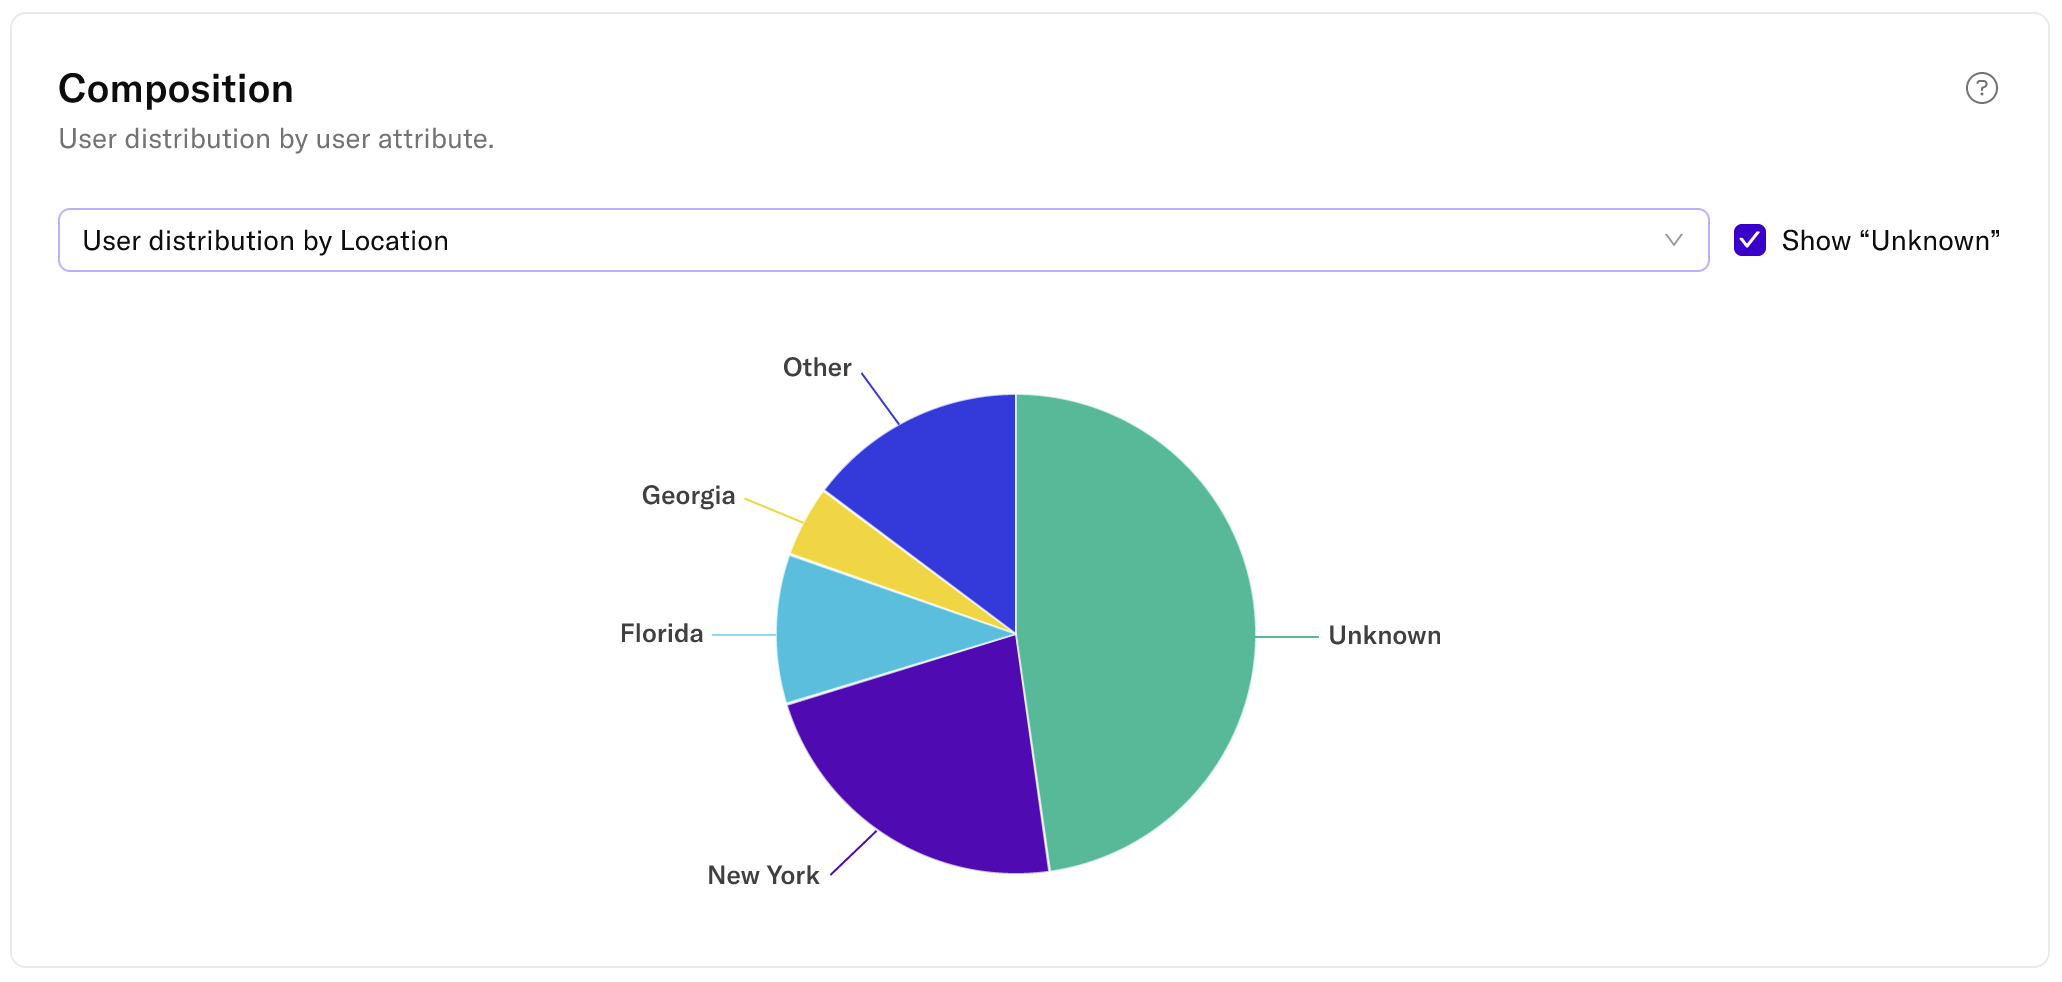
To view user distribution according to a different attribute, use the dropdown menu to select the attribute. The composition view only includes single-value, non-numeric, non-calculated user attributes. Calculated attributes, list-type (multi-value) attributes, and attributes whose values are numeric are not available for selection.
Additionally, the composition view does not support selecting attributes with high cardinality: attributes that have a high number of unrepeated values. This includes attributes such as:
- First name
- Last name
- Phone number
- Email address
- Physical address
- Date of birth
For example, a pie chart displaying the many unique values of “First name” would not be very useful in comparison to a chart displaying a breakdown of your audience by “favorite genre”.
If you select a timeframe other than Today, the pie chart is replaced with a line chart to represent your data over time.
View reach and composition metrics over time
For the Reach and Composition metrics, you can add additional filters to understand how these metrics change over time.
For Reach, see Audience Performance. The timeframe and averaging interval controls described below apply to Composition. If no historical data is available to calculate audience metrics over time, these filters are disabled. Audience metrics over time are not available for overlaps.
Select a timeframe
Use the first dropdown above each chart to select how far back you want to view data for. Options include:
- Today
- Last 7 days
- Last 15 days
- Last 30 days
- Last 60 days
- Last 90 days
This determines the time window displayed in the chart.
If no data is available for a given time period within your selection, the line chart will display a dotted line to indicate the gap:
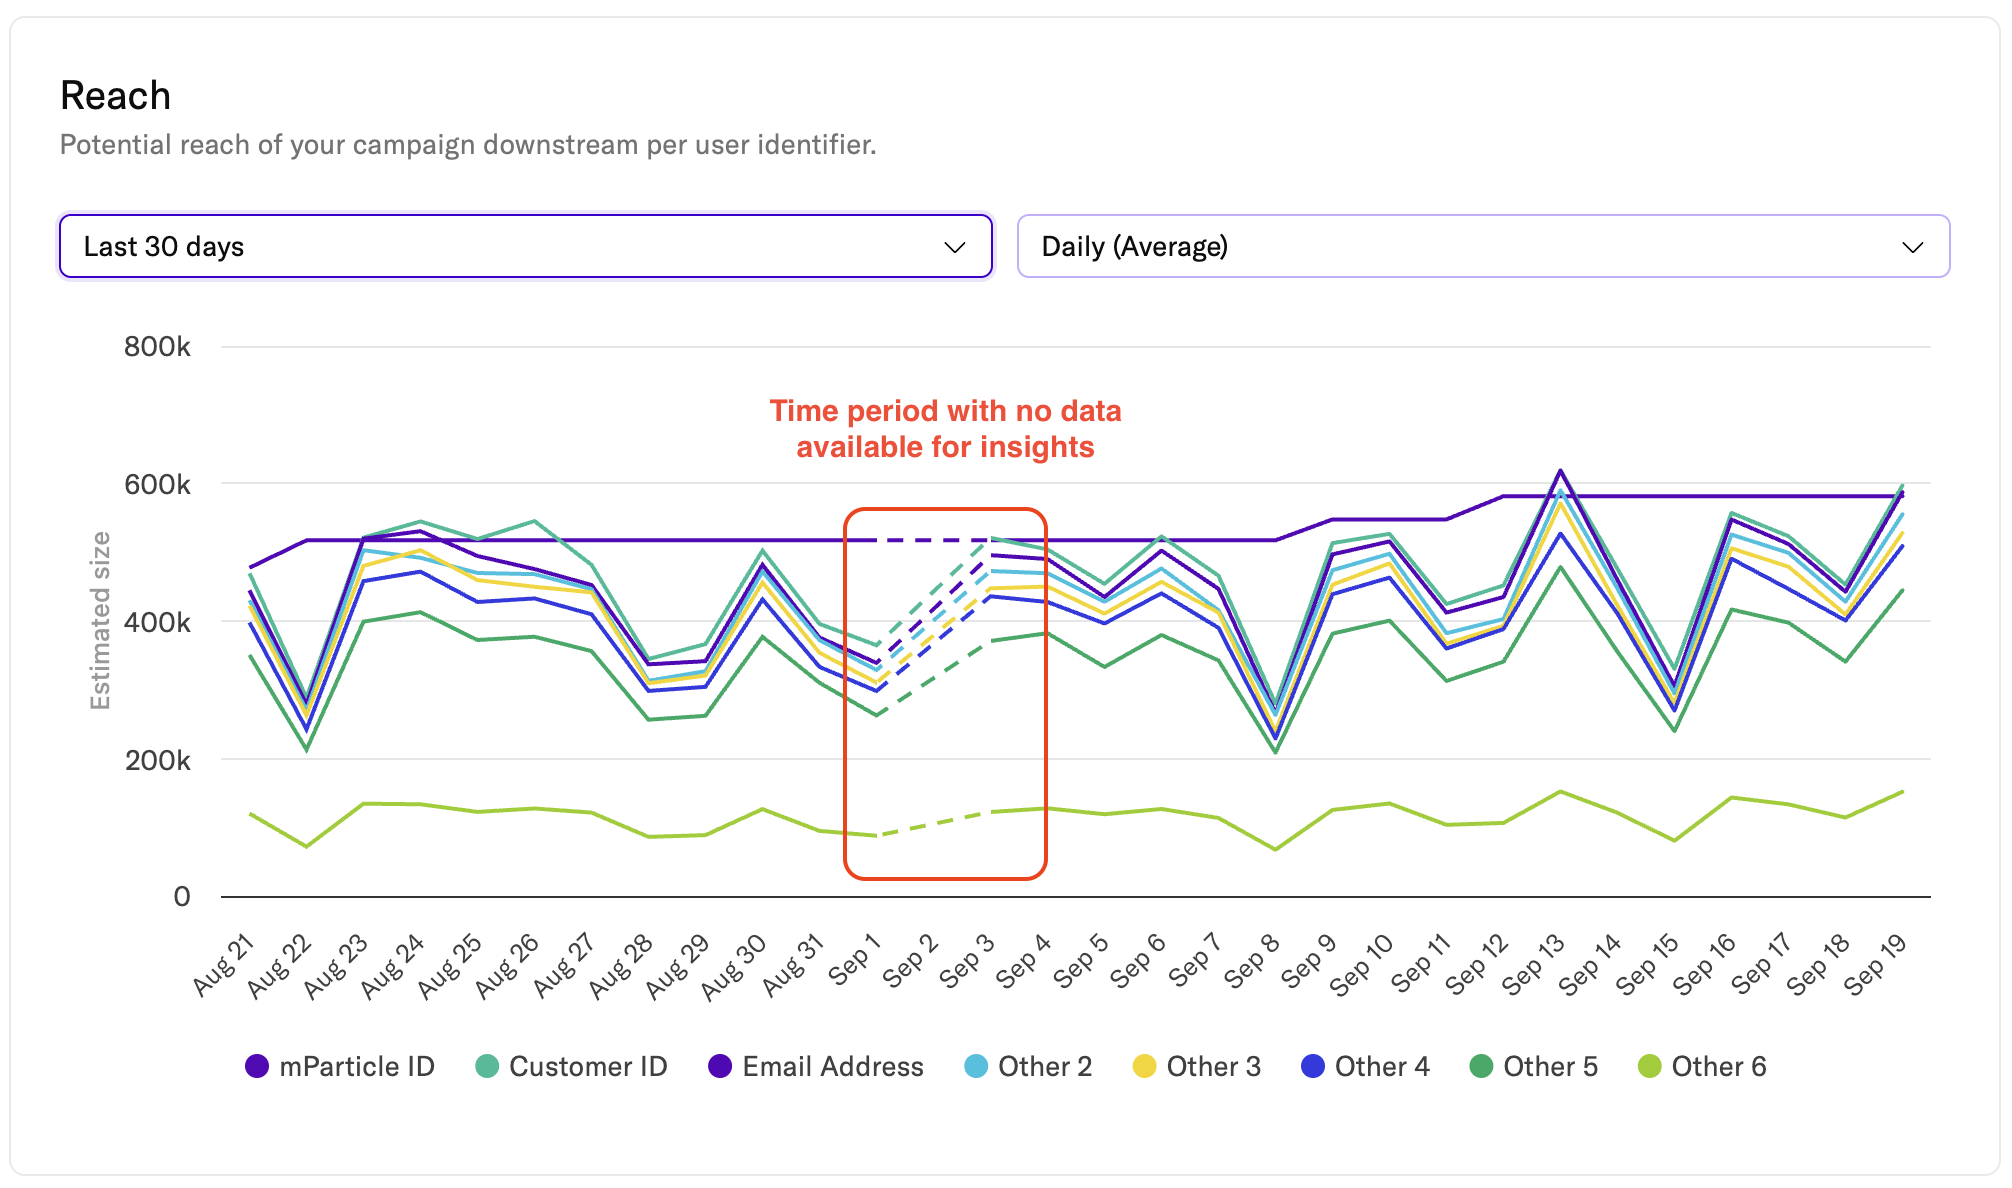
Data may be unavailable for one of the following reasons:
- The audience was inactive during that period.
- The period is earlier than the oldest available historical data.
- The period is earlier than the release of Audience Insights.
Choose an averaging interval
If you select a timeframe other than Today, a second dropdown appears allowing you to change the averaging interval. Options include:
- Daily (Average)
- Weekly (Average)
- Monthly (Average)
This setting smooths out fluctuations and makes it easier to identify broader audience trends.
Related tasks
Was this page helpful?
- Last Updated: September 25, 2026